Engagement History Dashboards are out-of-the-box dashboards that show campaign performance over time. This is how prospects have interacted with your Pardot (Account Engagement) campaign – your emails, landing pages, files, etc. associated with that campaign.
You can use Engagement History Dashboards on Campaigns, Accounts, Opportunities, Leads/Contacts/Person Accounts. It’s a ‘slice’ of B2B Marketing Analytics in your Salesforce org.
Part of the Engagement History collection of features, adding these dashboards to Salesforce page layouts are a ‘quick win’ to bring Pardot (Account Engagement) data into view – after all, our campaign efforts deserve to be seen across the organization.
First, let’s check:
- You’re using the Pardot (Account Engagement) Lightning app: Just like the majority of new features, this is a Lightning-only feature.
- Your Pardot Edition is ‘Growth’, ‘Plus’, or ‘Advanced’. What’s the difference? Each edition has a limited number of users who can view Engagement History Dashboards.
Step 1: Enable Engagement History Dashboards
- Go to Salesforce Setup, and search for Engagement History (it will appear under the Account Engagement section).
- Beside Enable Embedded Engagement History Dashboards (3), flick the switch to ON.
Note: It can take up to 24 hours to see any data in the dashboard.
Step 2: Add the Component to Campaign Pages
The Engagement History Dashboard is embedded on Salesforce Campaign pages as a Lightning component. Lightning components are added and arranged on Lightning Record Pages (different from Page Layouts!)
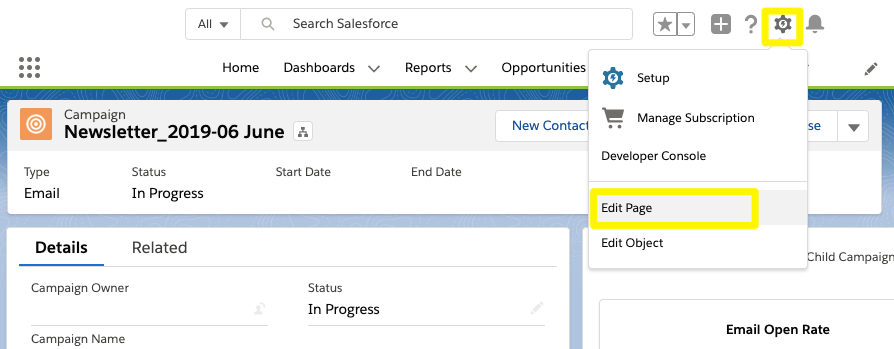
- Go to any Campaign. Click the cog icon, then Edit Page.

I have seen how page layout design can both help and hinder user productivity. Page clutter becomes a bottleneck, whereas tabs with a single function keeps features organised. I advise adding a custom tab to house the dashboard.
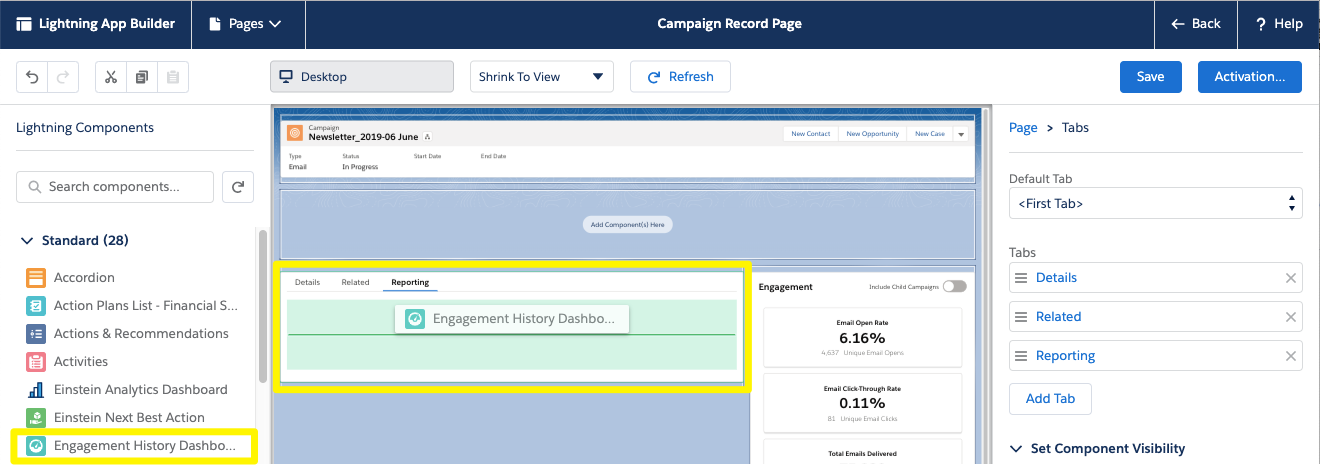
By clicking on the main area on the page a sidebar will appear, where you will have the option to Add Tab. Choose custom, and type ‘reporting’ (or any other label you want for the sub-tab):

From the left-hand sidebar, drag the ‘Engagement History Dashboard’ on to the Reporting tab you just created. Use the search box if you don’t see it in the list. Then, save the page.

Step 3: Assign the Permissions
Assign the Analytics View Only Embedded App permission set license to each user who needs to see the dashboard. View instructions here. If you do not manage users in your Salesforce org, it’s best to work with the Salesforce Admin, who will know how best to structure permissions among your users.
If your account doesn’t already have the system users Analytics Cloud Integration User and Analytics Cloud Security User, they are added to your account when you enable the feature. Support say that this can take up to 24 hours.

Step 4: Marvel at your Handiwork
Your dashboard will populate – note, this can take up to 24 hours for Pardot (Account Engagement) to crunch your data. Then, take a tour of your campaign data!

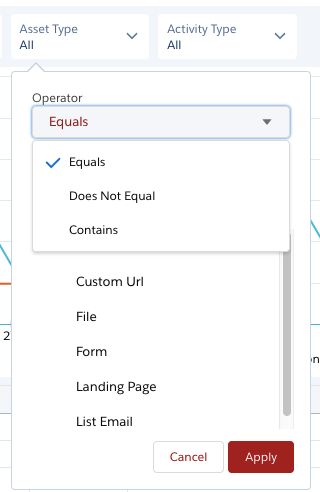
Use the filters to paint a different picture of your campaign. The filters available are:
- Activity date (relative dates, eg. Last 30 days, Next Fiscal Quarter)
- Asset Type
- Activity Type
What’s cool, is that not only can you choose which values include show on the chart, you can also exclude values – ideal for filtering out those ‘vanity metrics’, such as email opens.

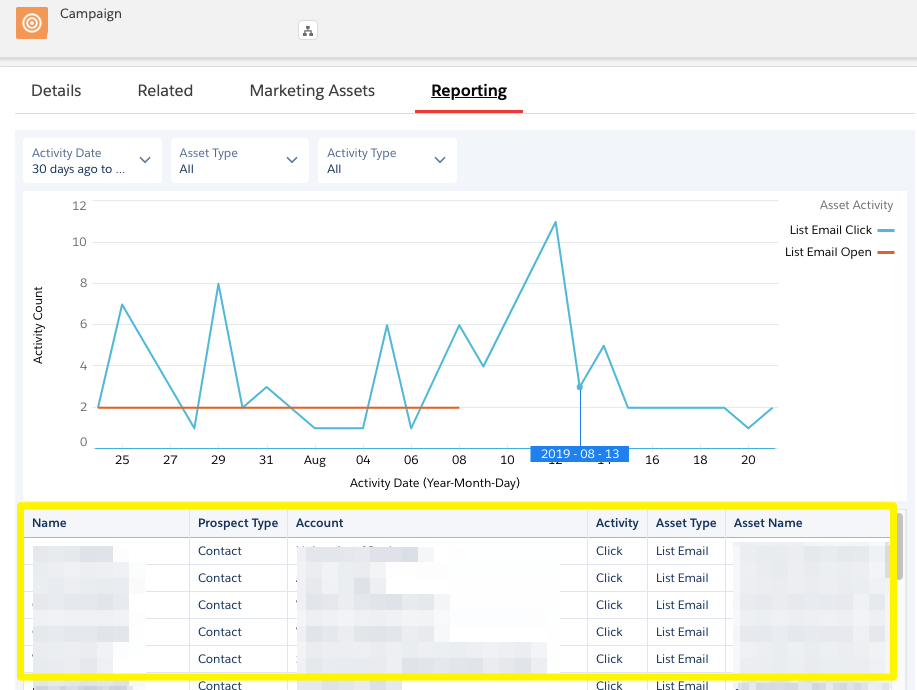
Below the chart, you will see all prospects and their level of interaction with which marketing asset – for example, a click on a list email:
Engagement History Dashboards: Accounts and Opportunities
Repeat the steps in this tutorial to add Engagement History Dashboards to other objects, including Accounts, Opportunities, Leads/Contacts/Person Accounts.
Engagement History Dashboards on Accounts

Engagement History Dashboards on Opportunities
Add the Engagement History Dashboard to Opportunities to see:
- Prospect activity of related contacts.*
- Details about the associated campaigns.
- A list of recent activity of related contacts.*
*Related contacts include both Opportunity Contact Roles or any contact related to the account.

Summary
This rapid-fire post has shown you how to enable and add the Engagement History Dashboard to your campaign pages. If this new feature has skipped your attention, you’re missing out on an enhanced view of your campaigns – it’s a 15-minute job that adds endless value.


Comments: