Salesforce reporting is possibly the most valuable capability you have at your disposal. With the wealth of information in your Salesforce org, it is vital that you know how to create a report in Salesforce so that your users can view the data that is relevant and important to them.
Salesforce reports are a list of filtered records. As you would expect from the #1 CRM in the world, they are powerful, intuitive, customizable, and they work well for organizations of all types and sizes. The Salesforce Report Builder is where users create reports, add filters and define the fields to display. Not only do you have access to many pre-built reports which you can run or customize, but you also have the ability to create Custom Reports specific to users’ requirements.
In this post, we’ll cover exactly how to create a report, as well as the different types of reports and custom reports. Don’t worry – it’s seriously easy!
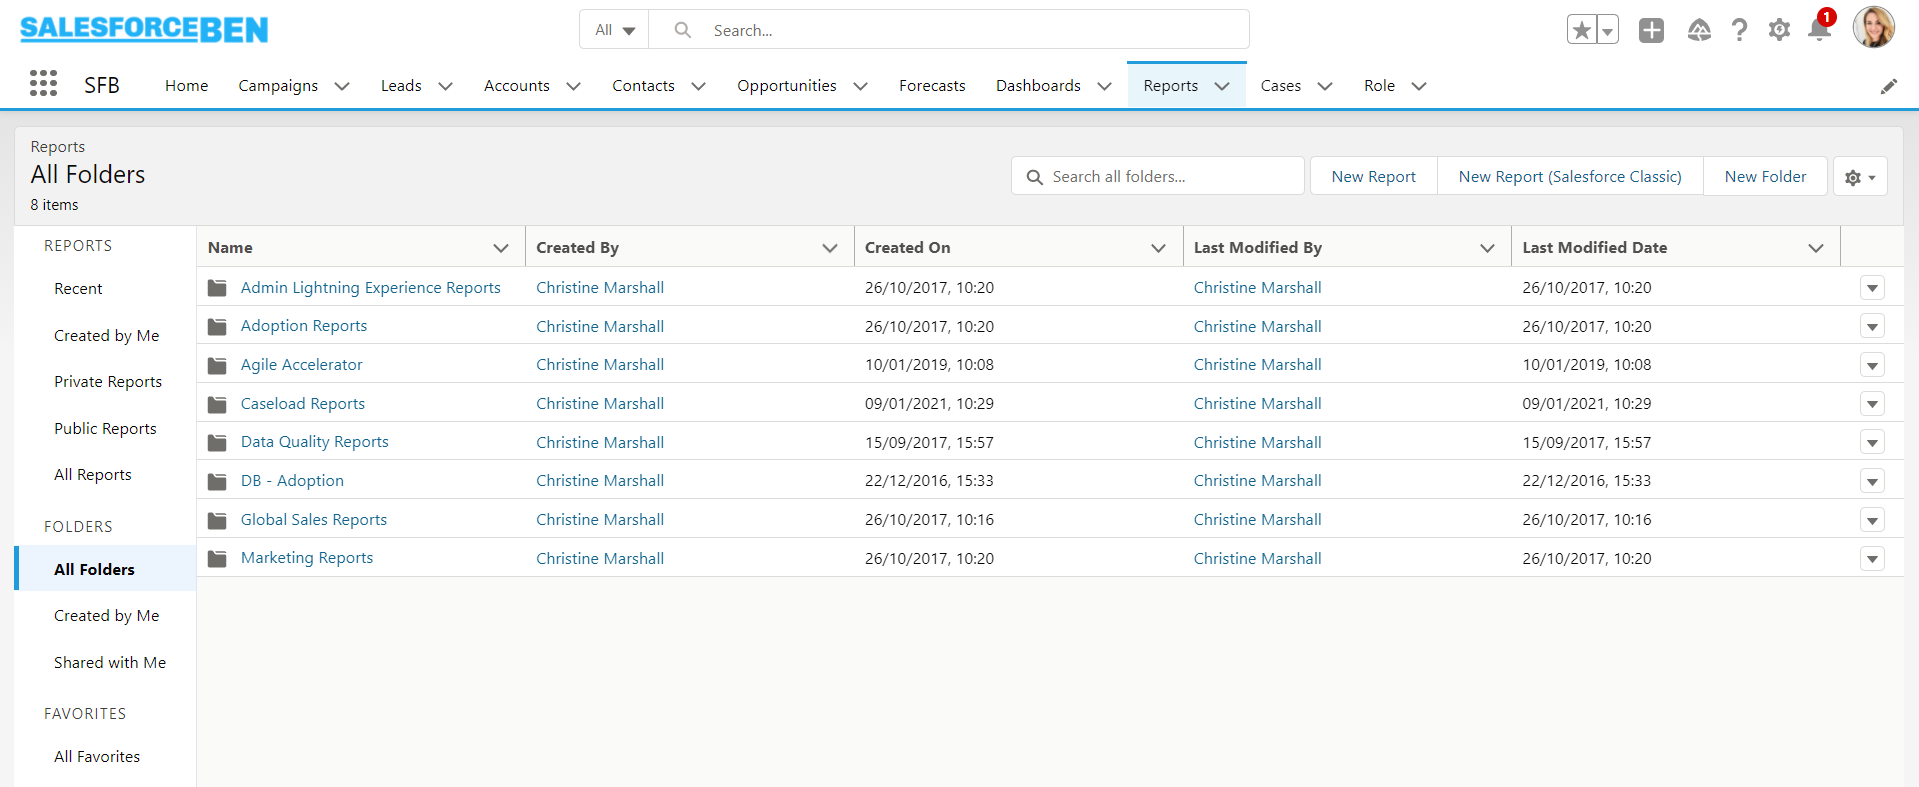

Types of Salesforce Reports
There are four types of reports that you can create in Salesforce: Tabular, Summary, Matrix and Joined. Each one is best suited to show different types of data, depending on what you want out of a report.
Tabular – This is the simplest of reports and is suited to just showing lines of data and nothing else. It is similar to an Excel spreadsheet. If you just want to show data without the need to show totals, calculations or groups of data, then this is the report for you. It is also best to use this report type if you are planning to export data.
Summary – As soon as you add a grouping, you will turn the report into a summary report. Summary reports are probably the most commonly used and are great for showing groups of data, e.g., if you want to see the number or value of opportunities per account, you would group your report by Account Name. You can also subgroup fields by dragging them under the initial group.
Matrix – Matrix reports are very similar to summary, but they allow you to group by rows as well as columns to see different totals. Building on the example above, you might want to see the value of opportunities per account, by month. So you would see that Edge Communications has $100,000 of opportunities in January, $50,000 in February and so on.
Joined Reports – Joined reports allow you to create two separate reports so that you can compare data. You could use a Joined report to show the total number of opportunities and cases per account, side by side.
Read more: Creating Joined Reports in Salesforce Lightning
How to Create a Salesforce Report
Tabular Report
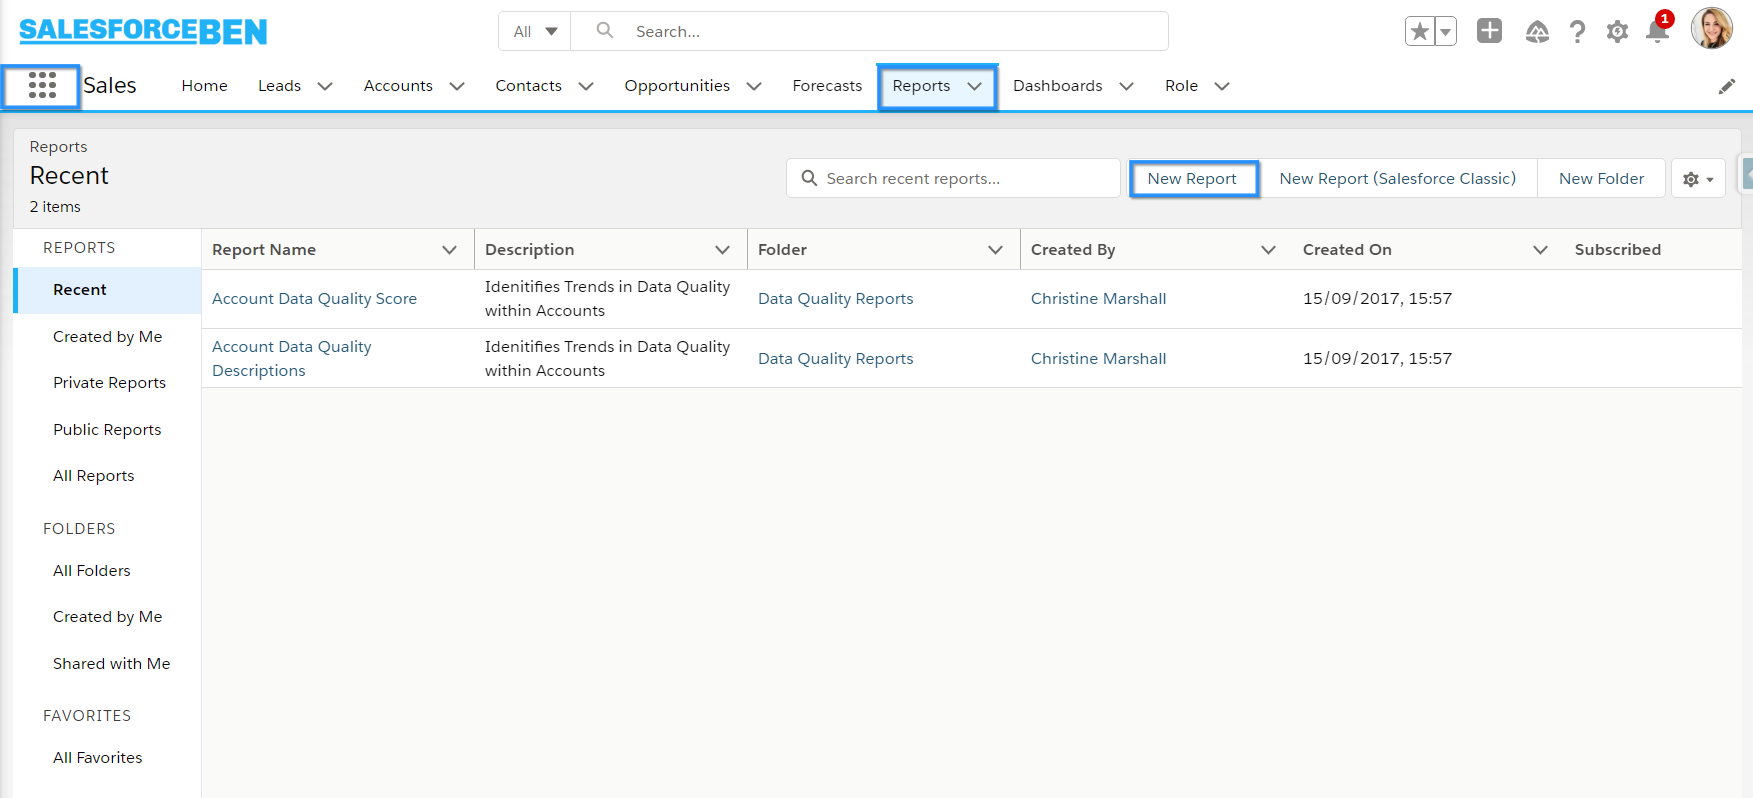
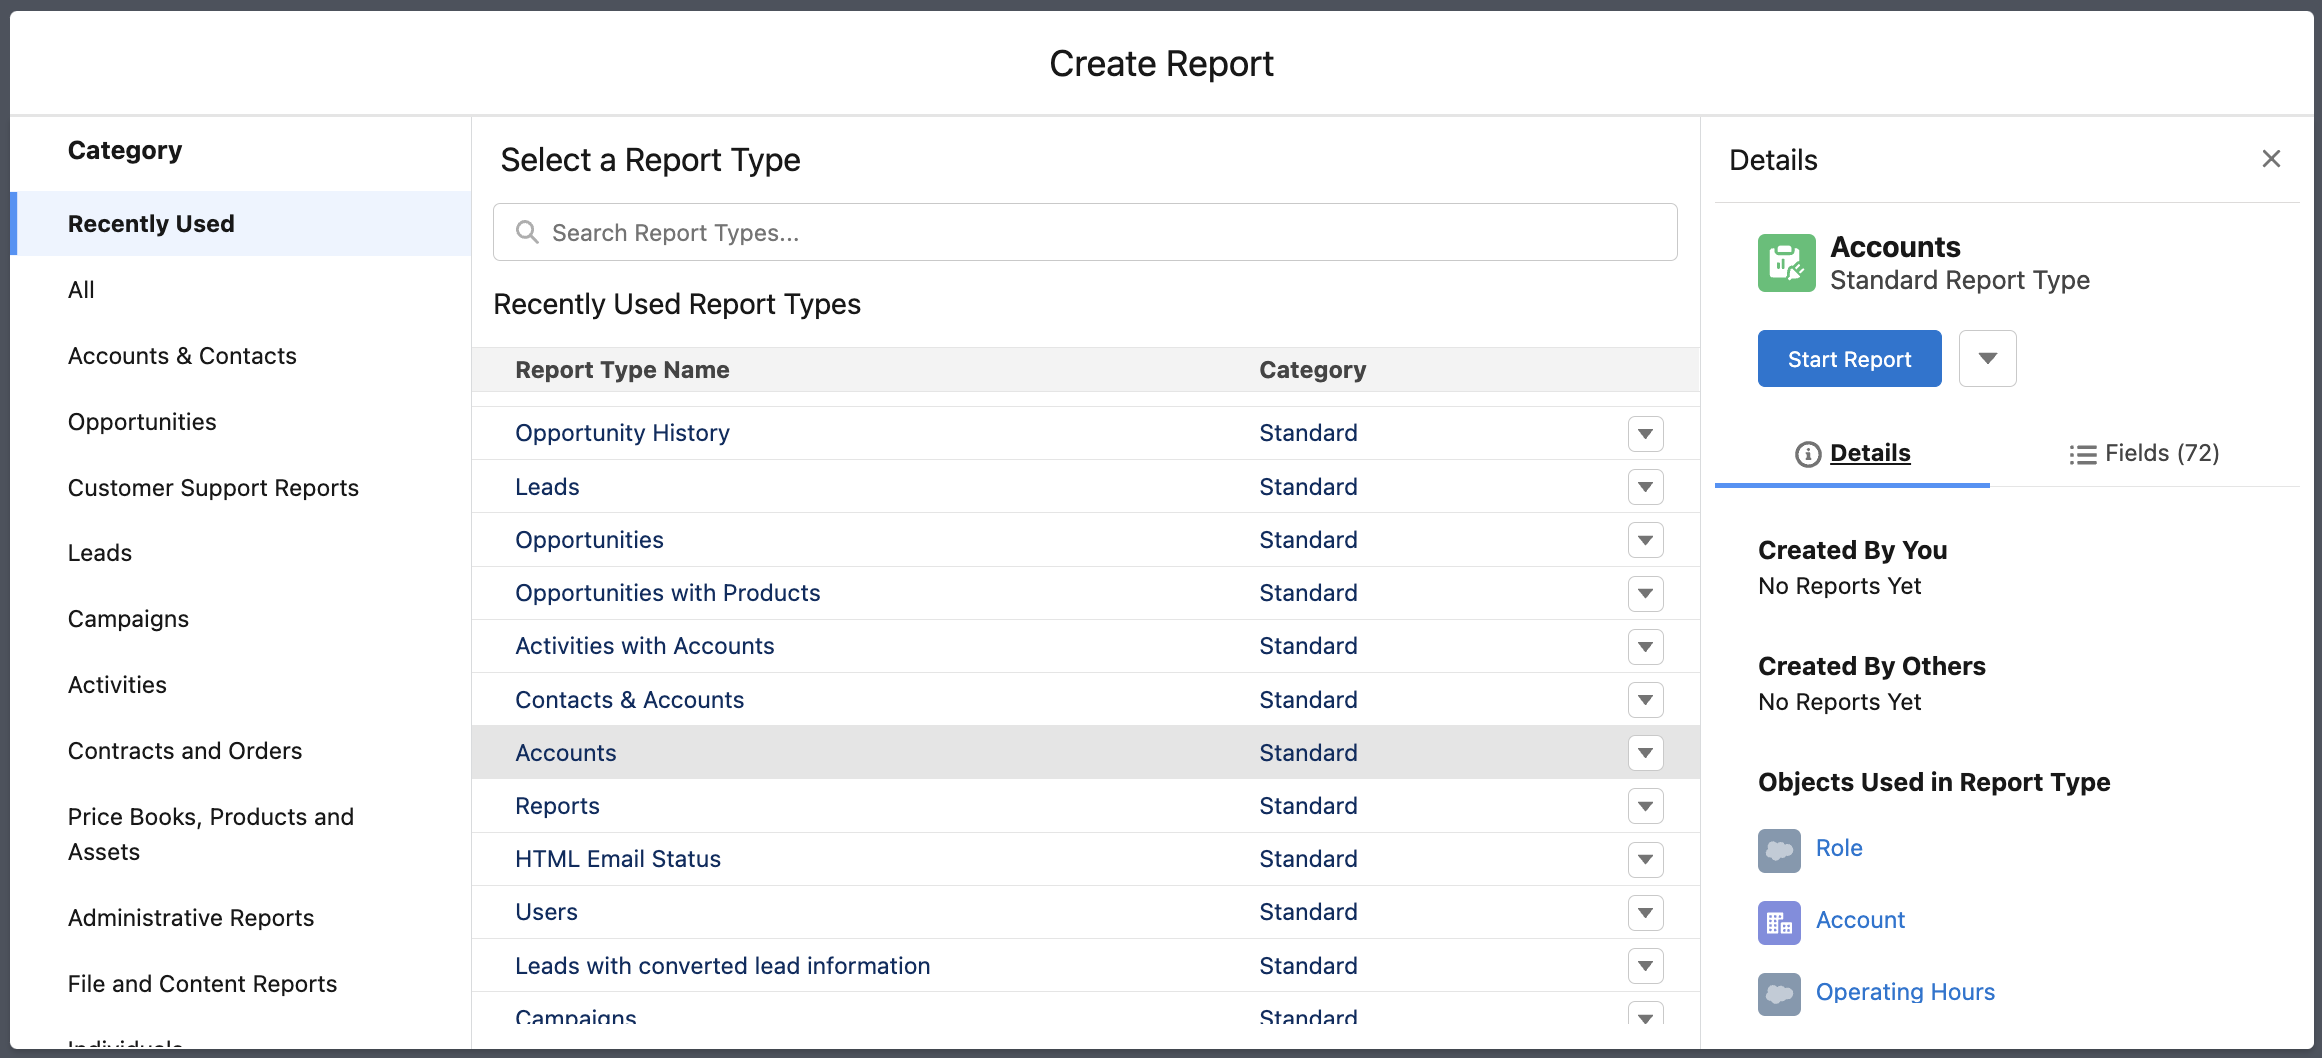
To get started, head over to the Reports tab. If you don’t see it, click on the App Launcher (9 dots). Then, click “New Report”.
Next you have to select the report type you’re going to use containing the standard and/or custom object(s) you are looking forward to reporting on – you will notice that after clicking on the name of any report type, a side panel will appear showing you additional details (such as the objects found in the report type), as well as which fields are available to either display or filter on within the report. This insight is available for both standard (such as Accounts or Opportunities) and custom report types.
For this example, I’m going to create an Accounts report. Click “Start Report”.
You’ll be taken to the reports canvas. The first thing you’ll want to do is select your filters by clicking on the “Filters” tab.
You can update the native filters, as well as add custom filters.
If “Update Preview Automatically” is turned off, you’ll need to hit refresh to see your results.
Next, head over to the “Outline” tab where you can choose which fields are displayed in your report. Native reports come with certain fields displayed as default. You can remove these by clicking the “X” next to them, as well as add your own fields by searching for the field name and selecting it. Fields can be reordered by dragging and dropping them up and down.
Don’t forget to hit “Refresh” if needed to see your updated report!
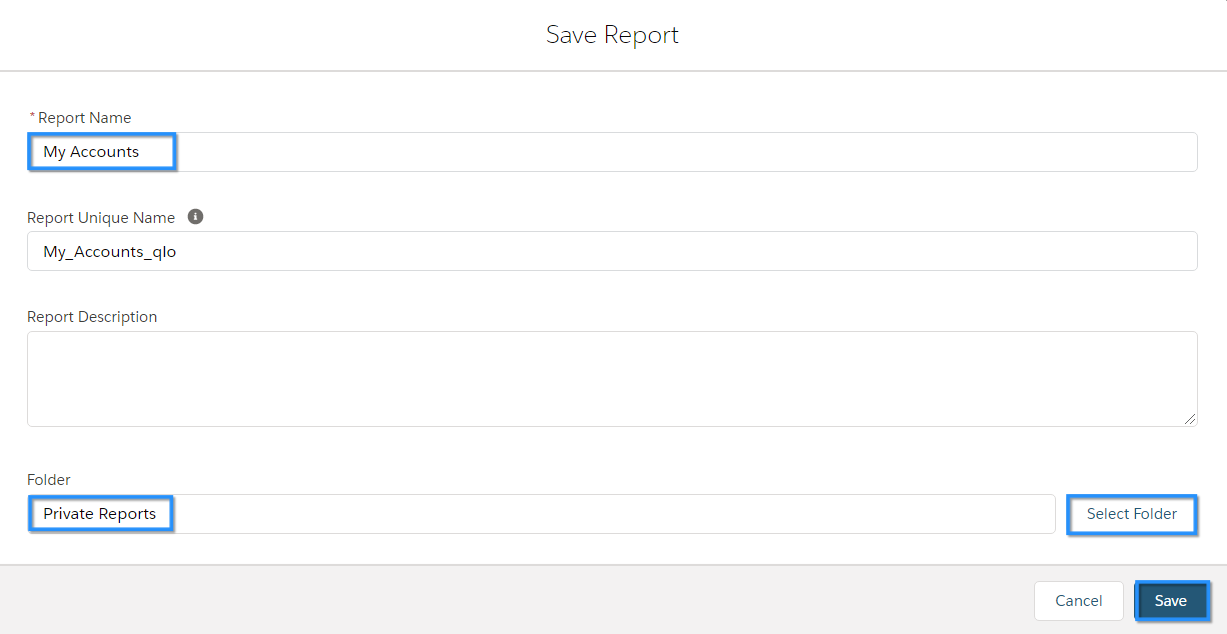
Click “Save & Run” to view your report. You’ll need to give it a name, optionally a description, and select the folder to store it in. Then click “Save”.
I have created a tabular report of my Accounts, perfect for exporting if needed.
Summary Report
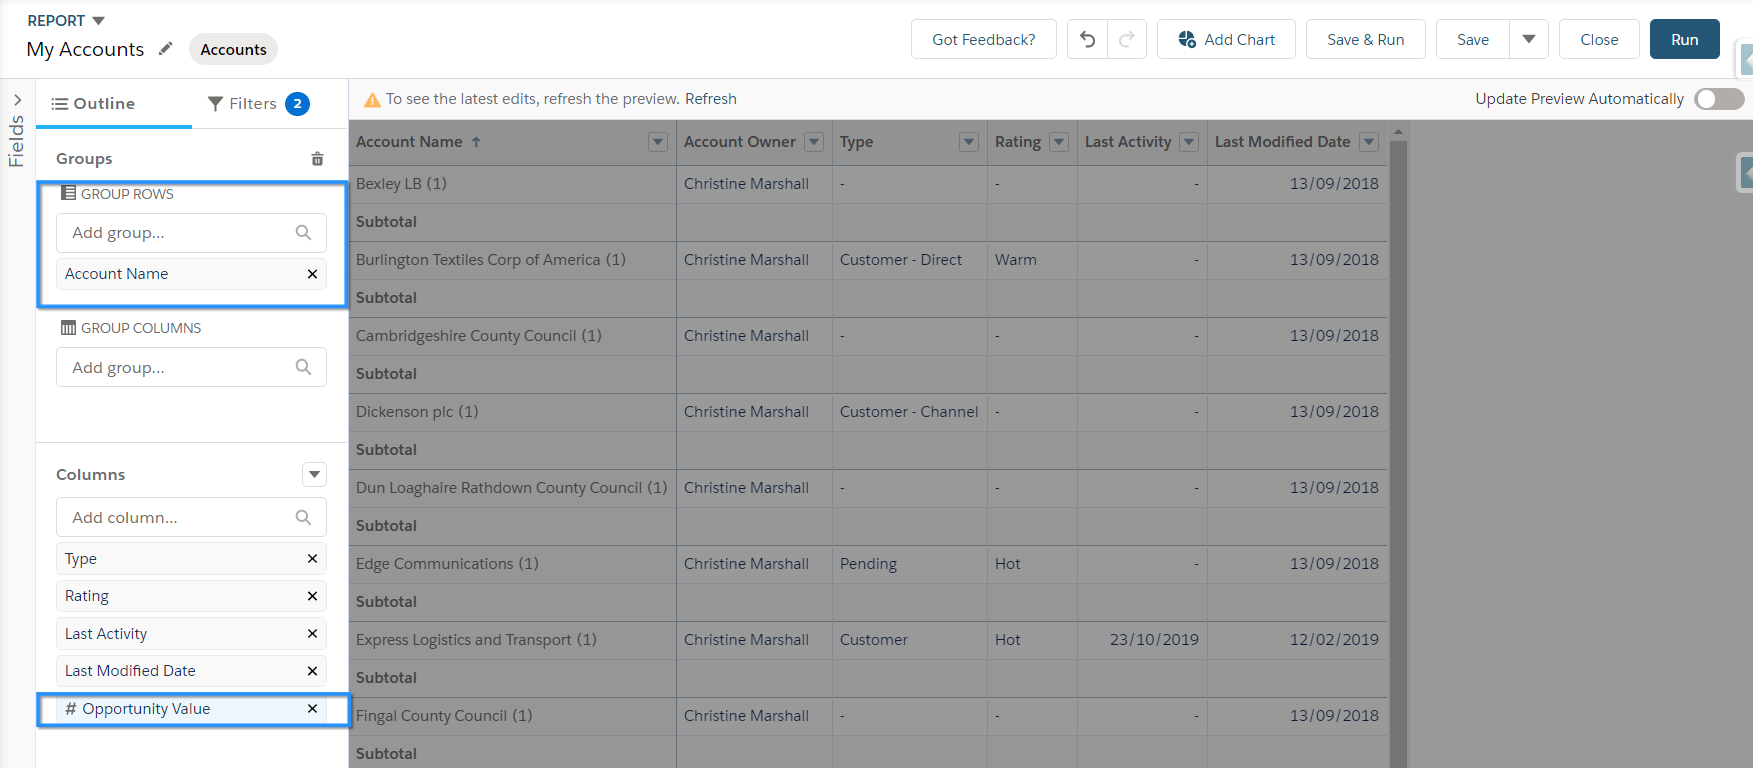
Let’s make this a bit more exciting! I’m going to add a grouping on the Account Name field. To do this I can drag the field from Columns to Group Rows if it is already on the layout, or I can start typing the field name in “Add group….” and select it. I’m also going to add an additional field called “Opportunity Value”. “Opportunity Value” is a custom roll-up field on the Account object that sums the value of Opportunities related to the Account (as long as they are not Closed Lost).
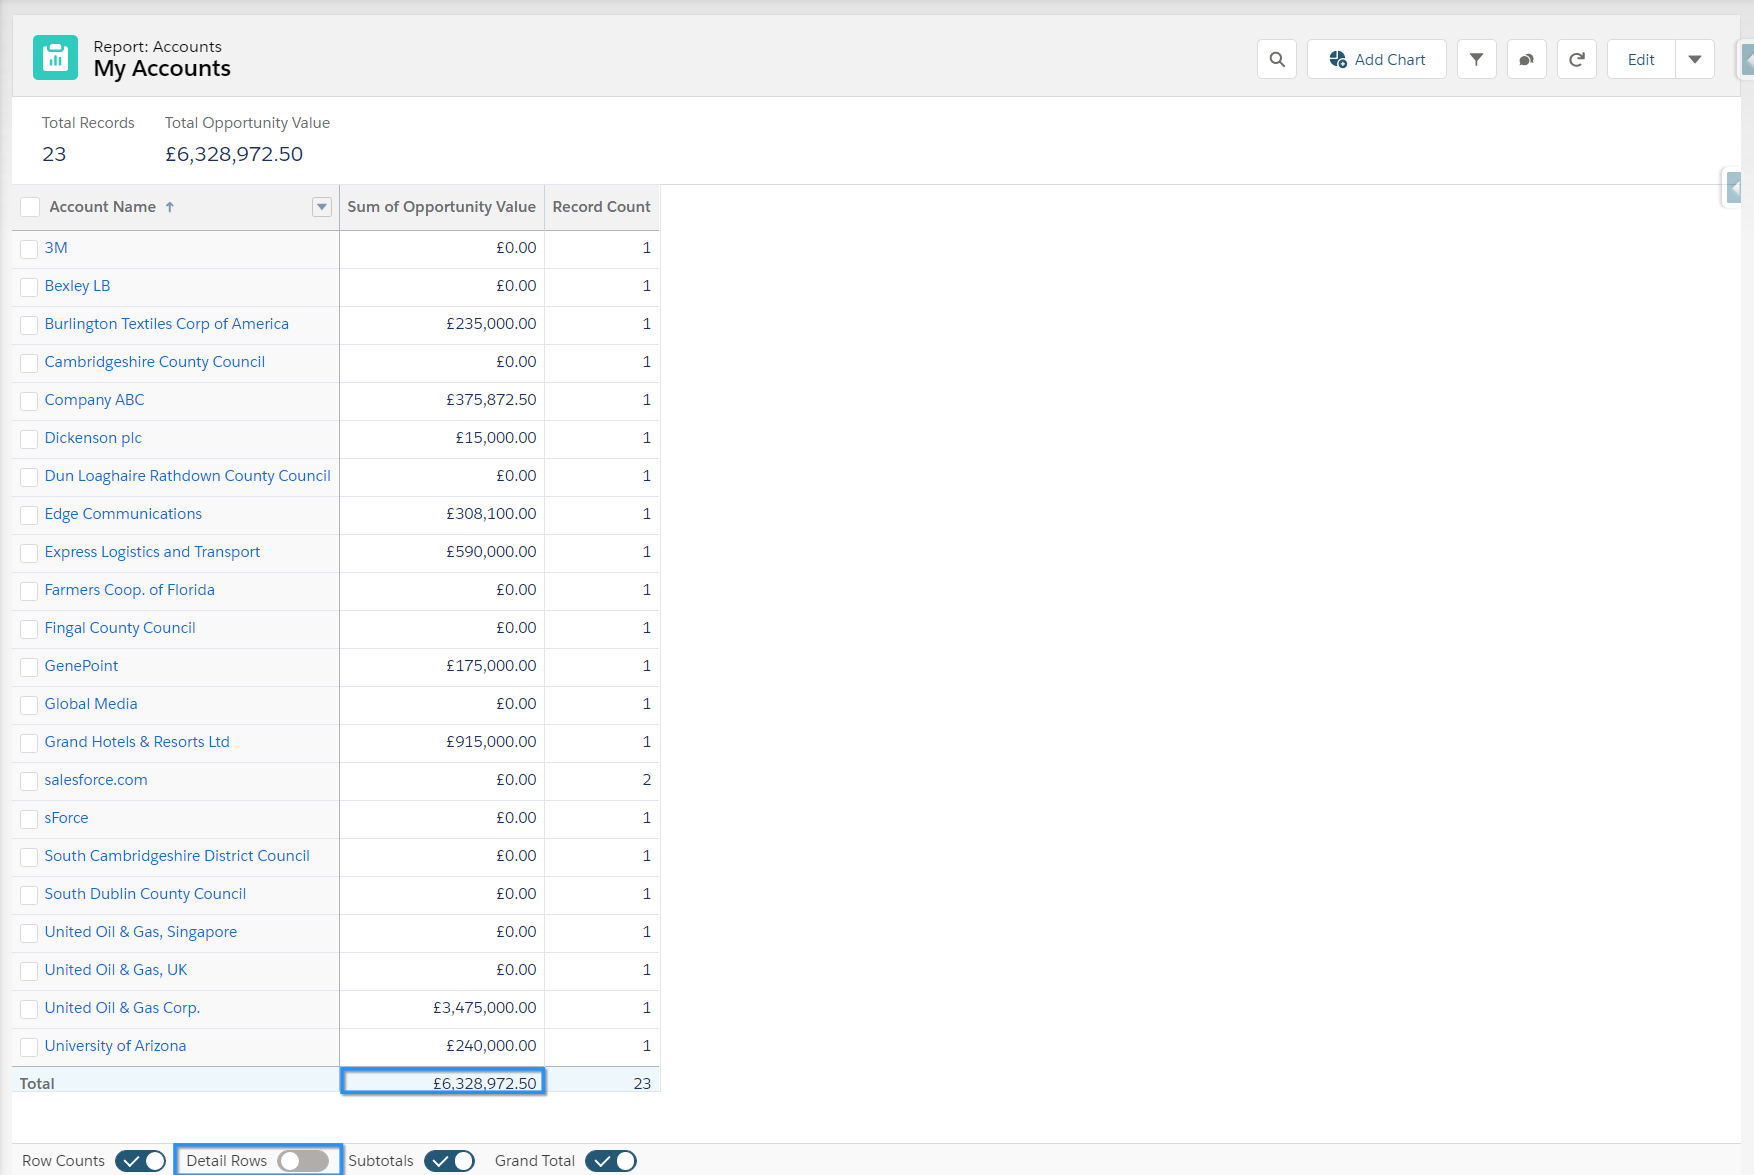
Hit “Save & Run”. We’ll see my new summary report, which now displays my Account, grouped by Account Name and displaying the current open Opportunity value. I’ve toggled the “Detail Rows” off to give me a clear view.
Matrix Report
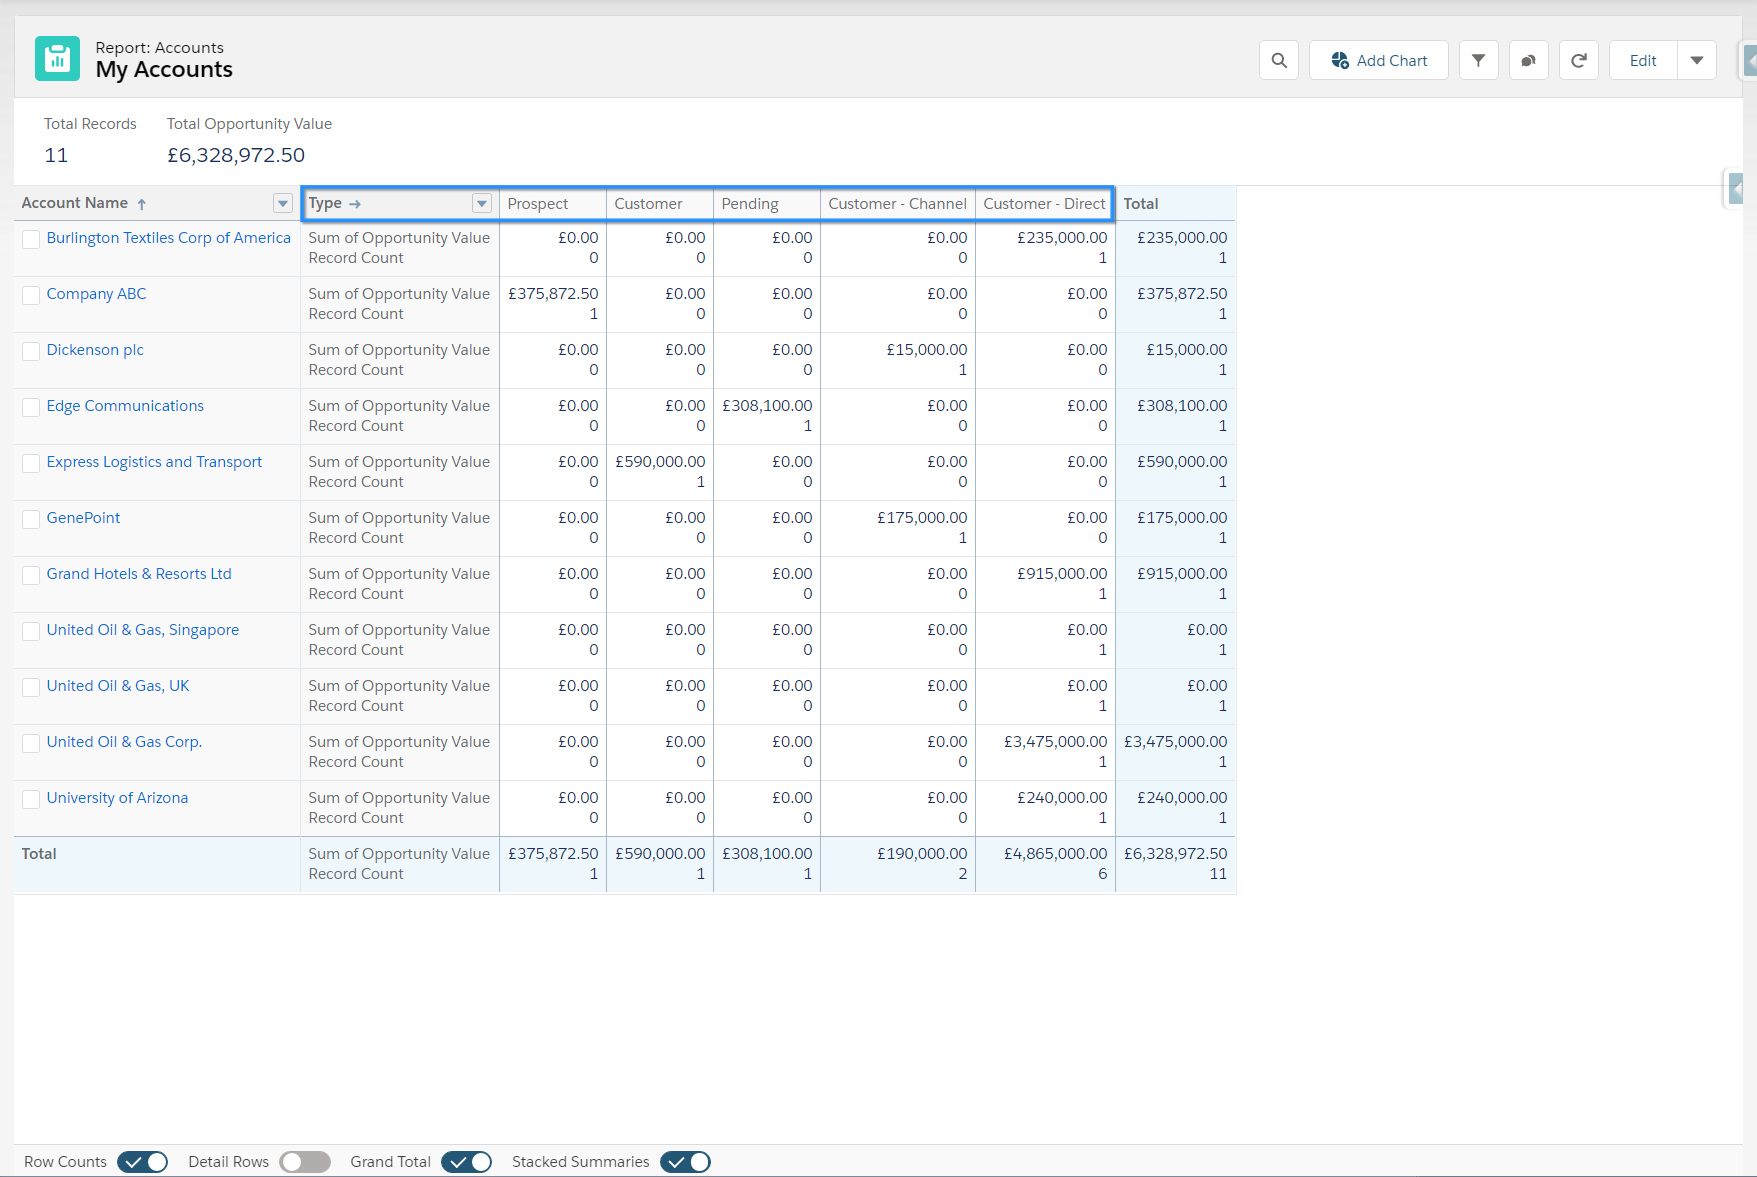
Let’s take this one step further…and add another grouping, this time a “Group Column”, to display the “Type” of Account.
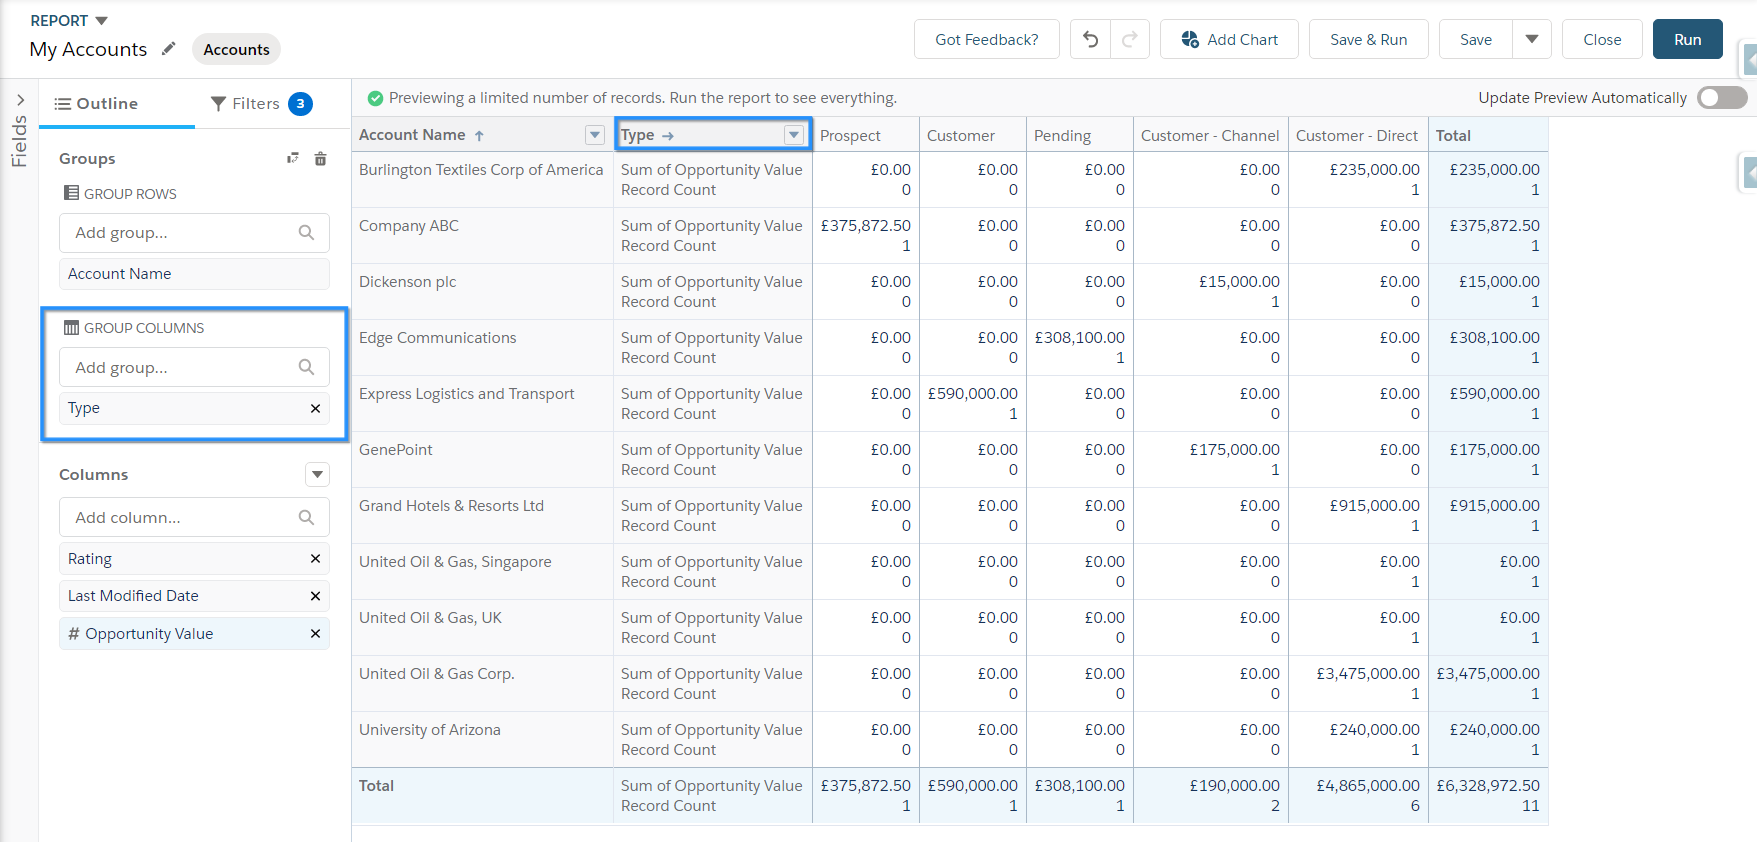

We have now created a matrix report and can see the Opportunity value for each Account, as well as for each “Type” of Account.
Report Charts
While we’re here, let’s add a report chart. Click on “Add Chart”. If you’ve previously added a chart, you’ll simply see a chart icon.
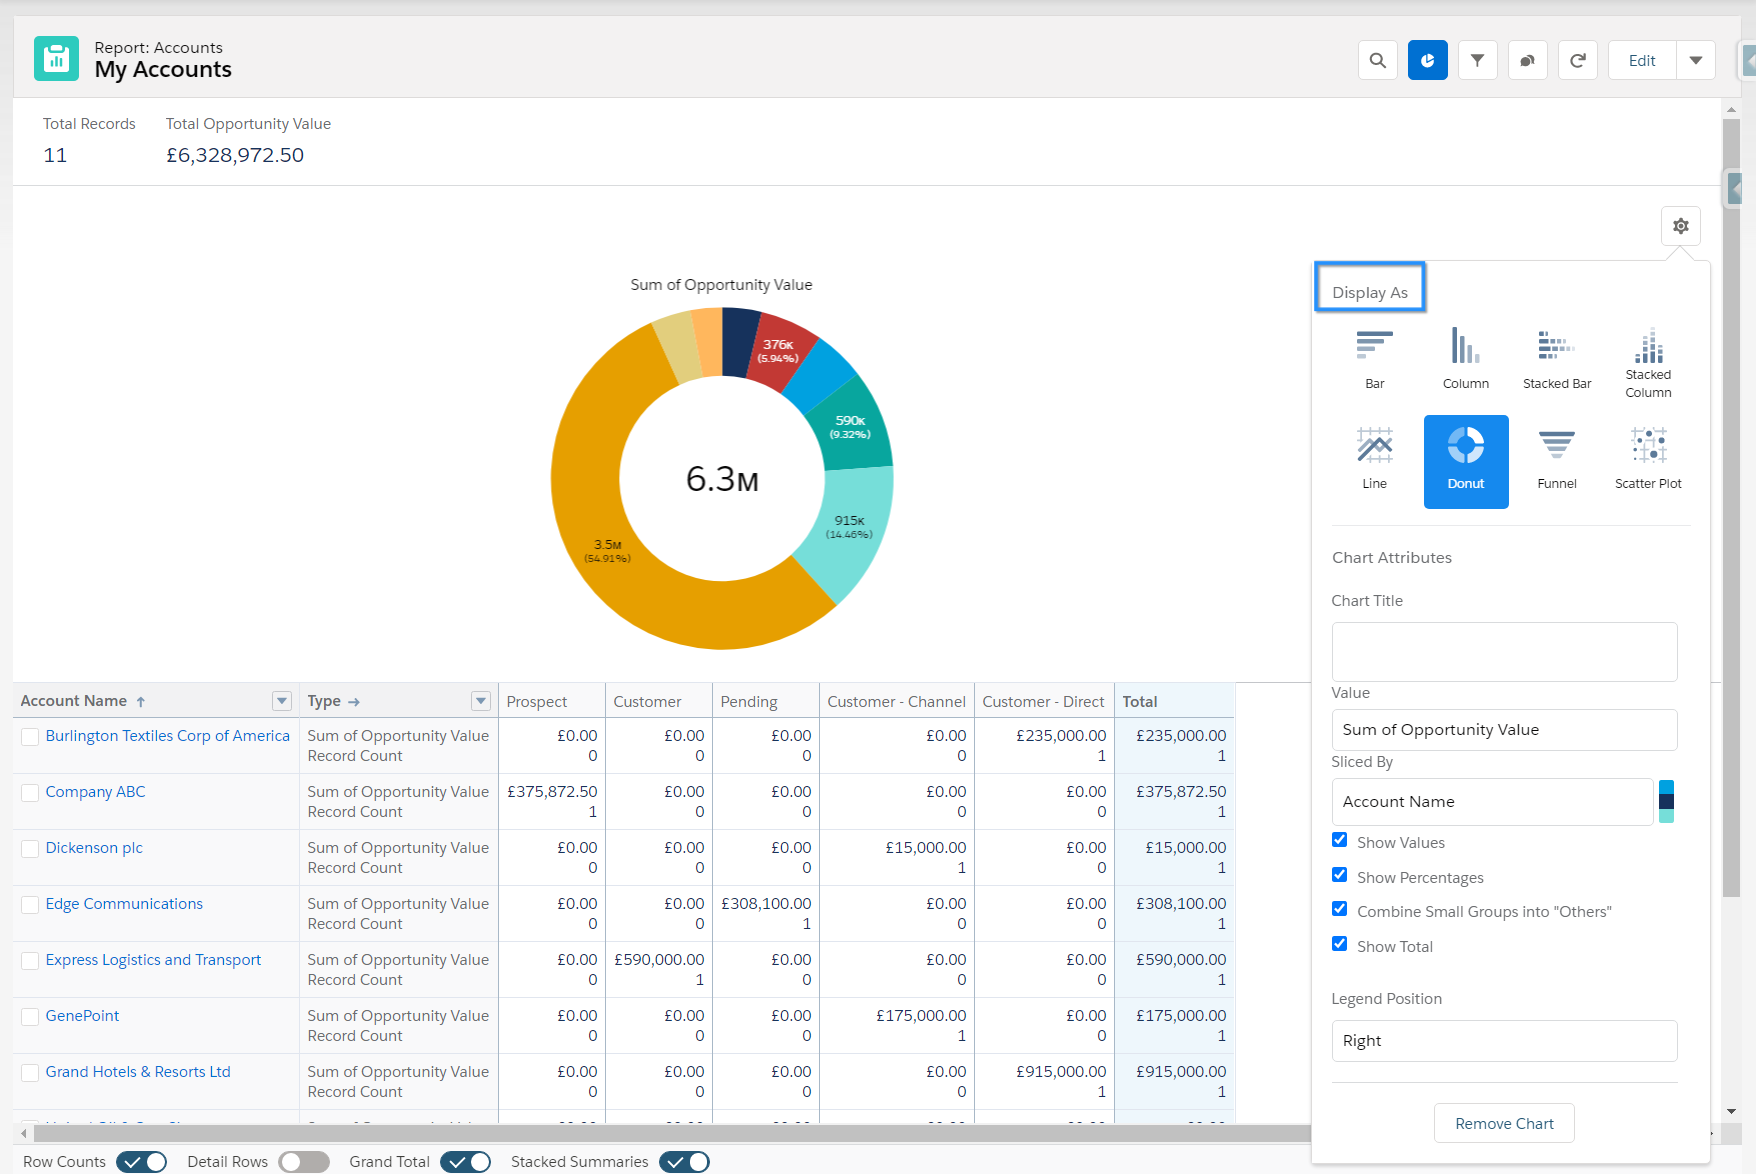
Once a chart appears, you can change the chart type by clicking on the gear icon.
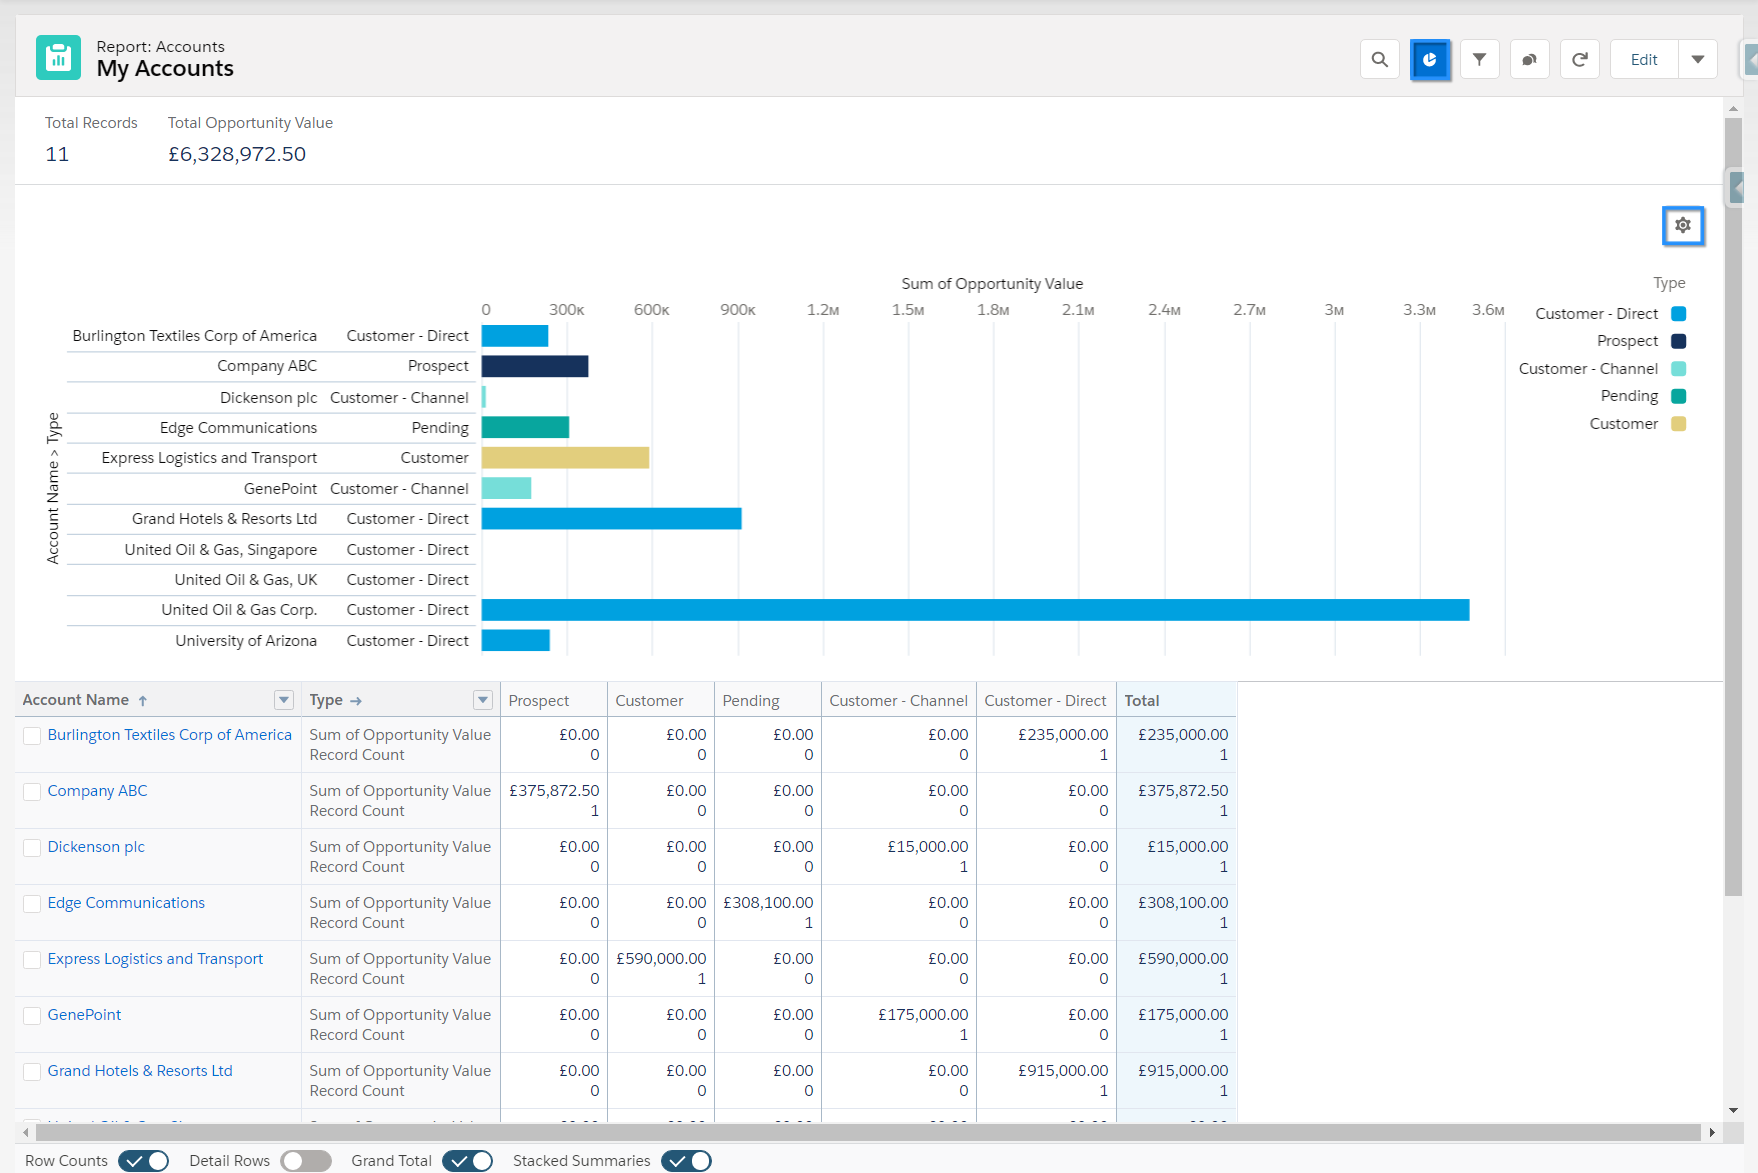

From here, choose your chart type, as well as other chart options such as “Show Values” or “Show Percentages”.
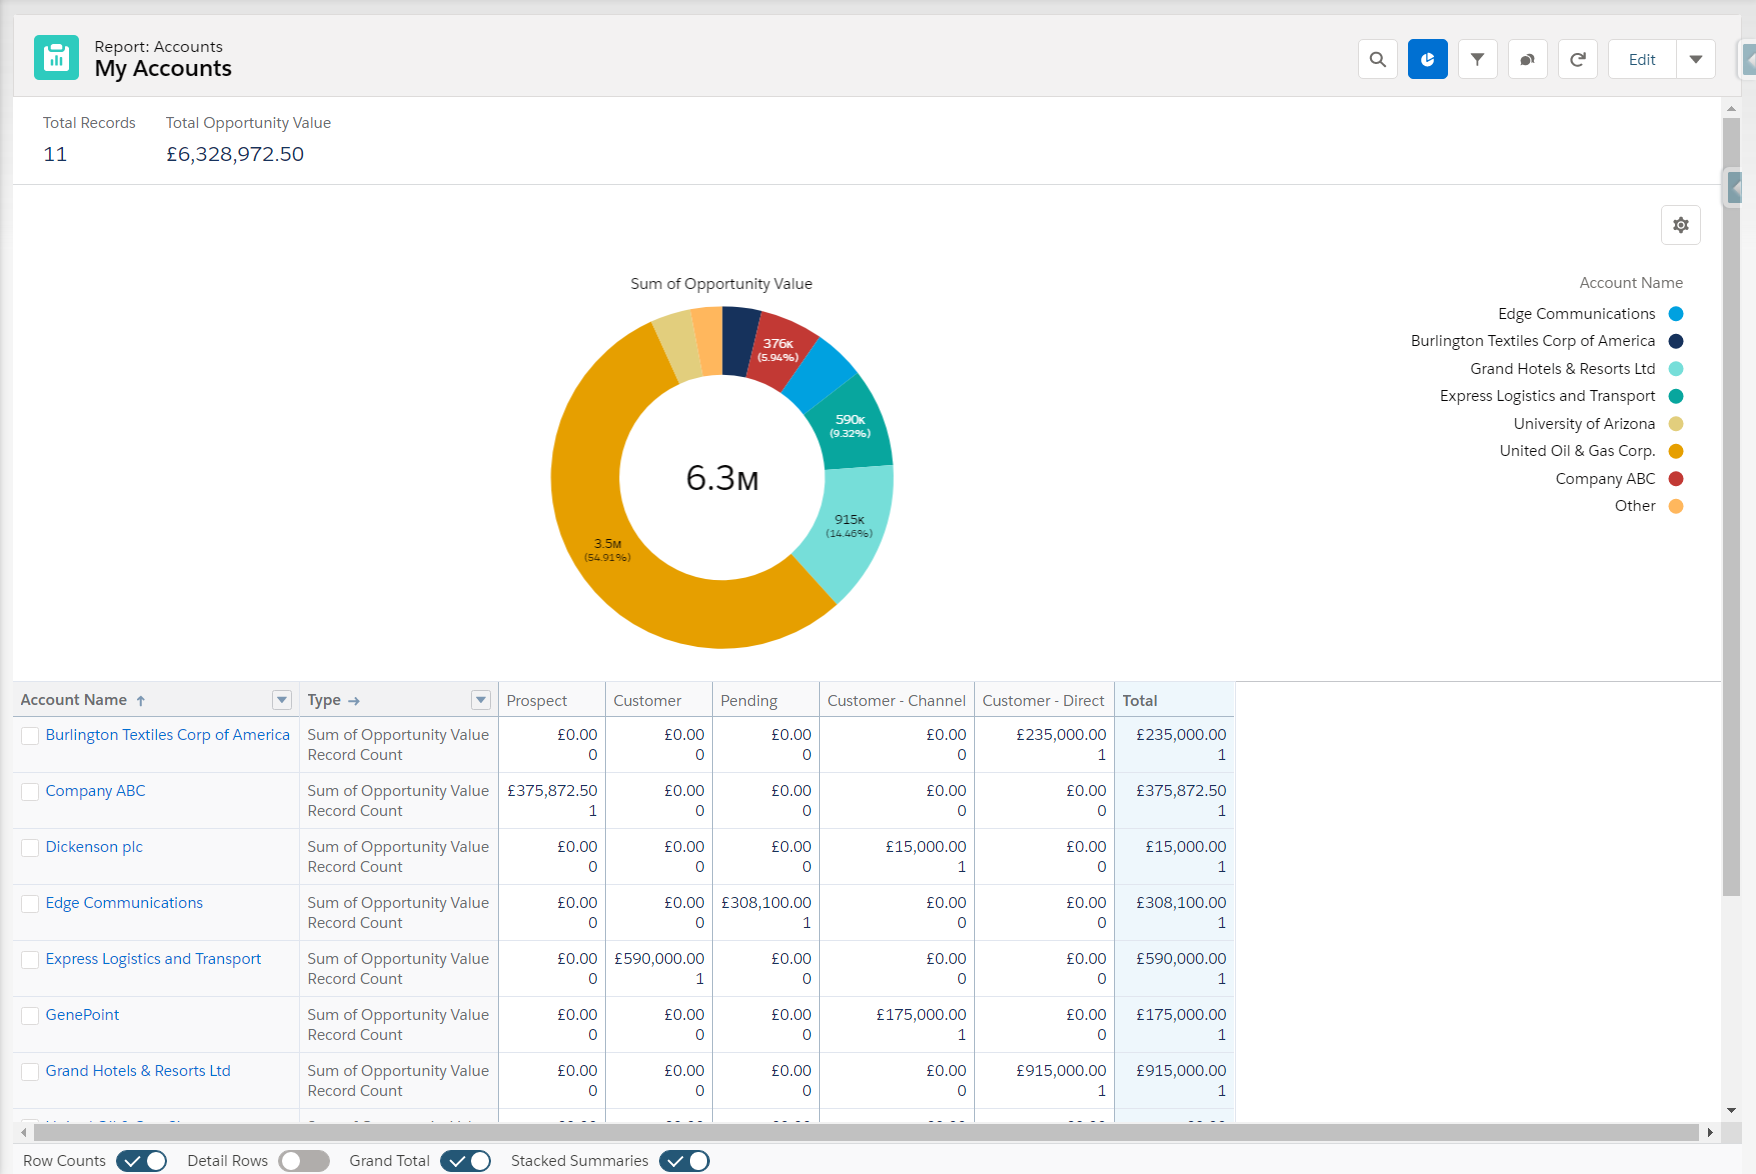
And that’s it! Our report now displays a useful chart, showing the sum of Opportunity value per Account.
Charts can be toggled on and off at any time by clicking the chart icon.
Salesforce Report Features
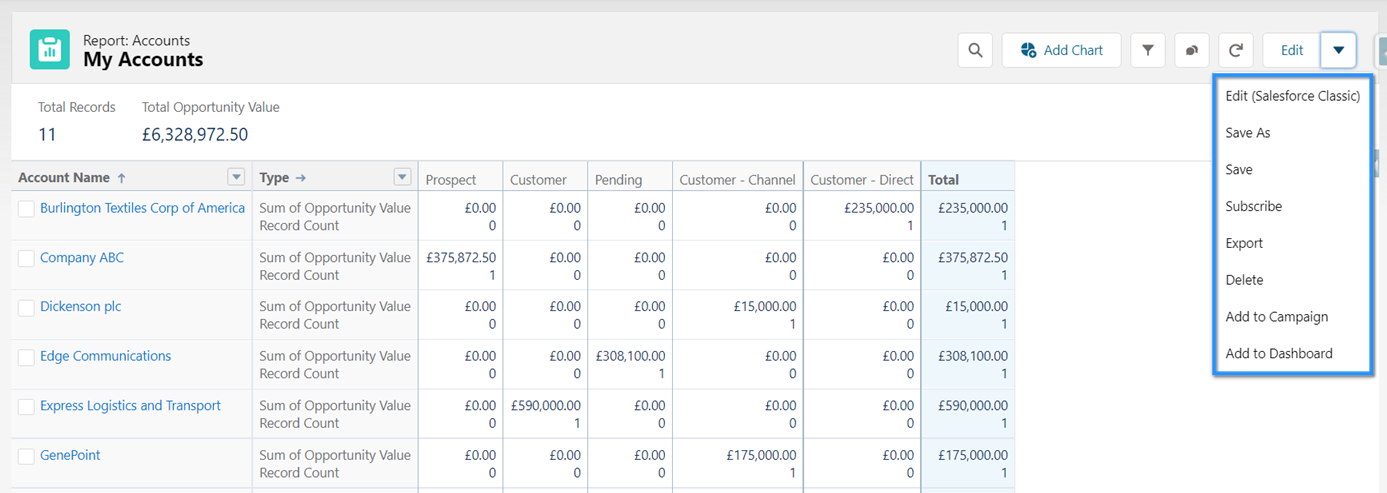
While you’re viewing your report, there are a couple of other features to be aware of. Click on the drop-down next to “Edit” and you’ll see you can:
- Save As – Save a new version of the report
- Save – Save changes to the current report
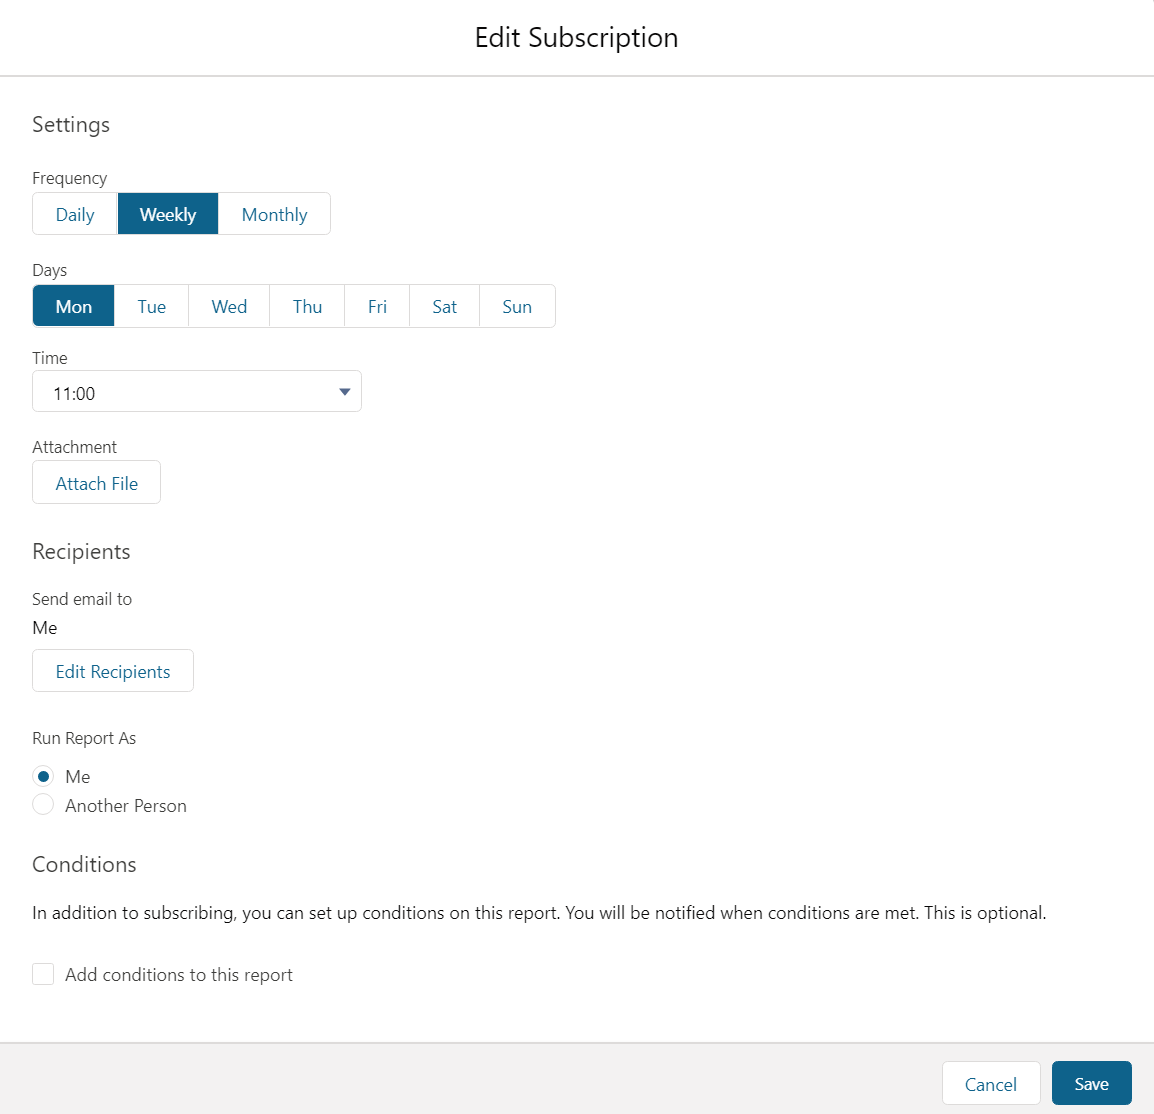
- Subscribe – Subscribe to a report to receive an email with a frequency you specify
- Export – Export the report to Excel or CSV
- Delete – Delete the report
- Add to Dashboard – Add the report as a component in a dashboard
The actions you see will depend on your permissions, for example, not all users will (or should) have the ability to delete or export reports!
Scheduling a Salesforce Report
In Lightning, you can subscribe to up to five reports, which you will then receive via email. To subscribe, a user must have access to the folder a report is stored in.
You can choose to receive the emailed report daily, weekly or monthly on a specific day and time.
When you subscribe to a report, you can opt to receive the results as a formatted spreadsheet and can subscribe yourself and/or other users.
You have the option of running the report as yourself or another user; be aware that the recipients will see whatever data the running user has access to, so this may result in them seeing more or less data.
Additionally, you can add conditions to a subscription so you only receive it when those conditions are met.
Salesforce Custom Report Types
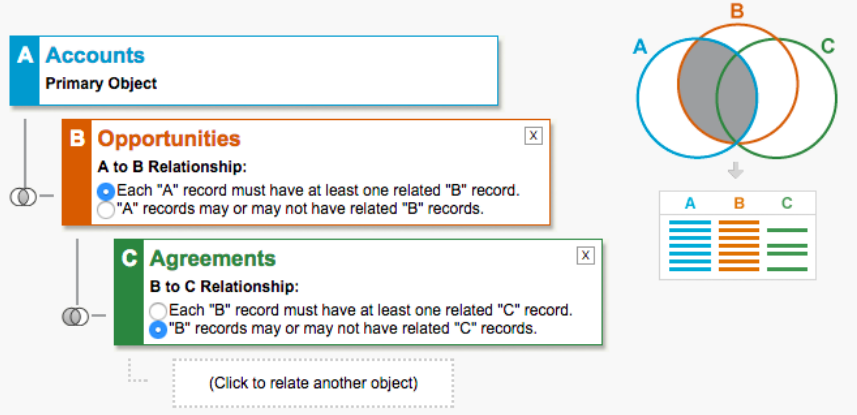
In some instances, the native reports just won’t cut it. Perhaps you need to report on more than 2 objects, or you want a report to display records “without” other associated records, for example, Contacts without Accounts. In this instance, you would need to create a custom report type.
Custom report types have multiple benefits:
- Multiple Objects: add up to 4 layers of objects, as long as they have a parent-child relationship
- Fields via Lookup: you can add fields into the report from any related object
- Create, remove, rename and reorder sections and fields
- Default Columns: you can control which columns already display on the report when you create a new one
For more information, check out our article “4 Features of Custom Report Types”.
Create Your First Report!
Now, over to you. Have a go at creating the following reports in a Salesforce sandbox/developer org:
- Accounts and Contacts report, containing contacts created this week.
- Opportunities that are closed (closed won and closed lost).
- Cases grouped by type (Summary report).
- Leads with converted Lead information, showing any Opportunities that have been created from converted Leads.
Resources
- Trailhead: Reports & Dashboards for Lightning Experience
- Trailhead: Analyze Your Data with Reports and Dashboards
- Trailhead: Quick Start: Reports & Dashboards
- Standard Report Types




Comments: