

Lightning Web Components (LWC) use modern web development standards, including HTML and JavaScript, to create powerful and reusable components for Lightning Experience and other websites. However, as with any development effort, debugging and troubleshooting can be a significant part of the process.
In this article, we will explore several solutions for debugging LWC, as well as their advantages and disadvantages.
Browser Developer Tools
One of the most basic and widely used ways to debug LWC and the frontend part, in general, is to use the browser’s developer tools. Most modern web browsers come with developer tools that can be used to debug LWC.
The most commonly used developer tools are those in Google Chrome, which can be accessed by right-clicking on a web page and selecting Inspect or by pressing F12 on the keyboard. These tools provide a wealth of information about the component, including the component’s HTML, CSS, and JavaScript. You can also use the browser’s built-in debugging tools to set breakpoints in your component’s JavaScript code, step through the code, and see the values of variables at different points in the execution.
Top 5 Chrome DevTools Functions for LWC Debugging
- DOM Tree: The Elements tab provides insight into the component structure and can be used to identify any unexpected elements or nodes. By viewing the DOM Tree, developers can view a component’s attributes, style, and any child components that have been added.
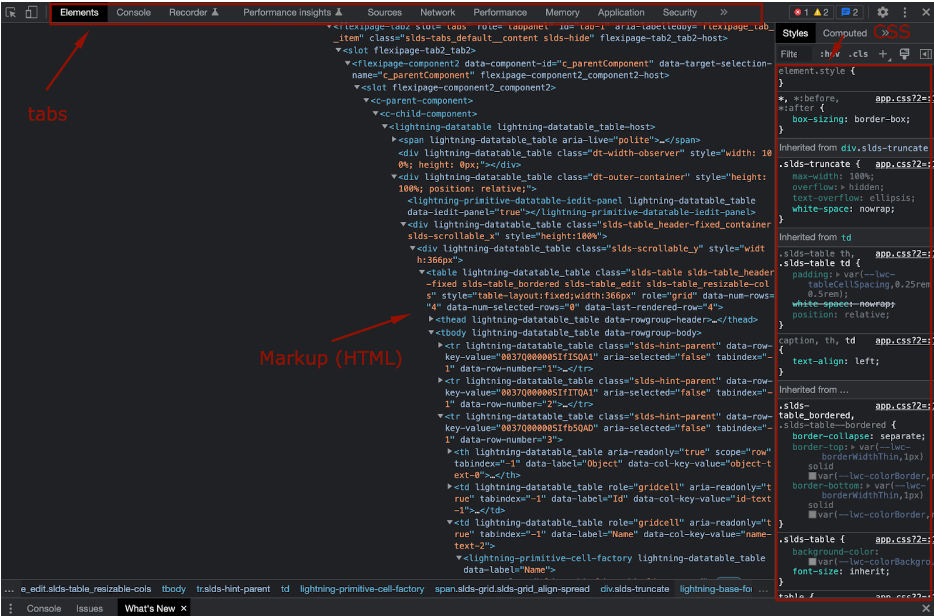
- Console Tab: The Console tab can be used to log errors and warnings that occur in the application. It helps track down any issues that occur during development.
- Sources Panel: The Sources panel allows developers to view the source code for their application and set breakpoints. This can be useful for debugging any issues with the code or for inspecting the state of the application at any given point.

- Network Tab: The Network tab allows developers to view all of the requests that have been sent to the server and any responses that have been received. This can be useful for identifying any requests that are taking longer than expected or any requests that are not completing successfully.
- Performance Panel: The Performance panel provides a view of the application’s performance. It helps to identify any potential performance issues or to monitor the performance of the application over time.
Salesforce Lightning Inspector Extension
Another useful tool for debugging LWC is the Lightning Web Components Inspector – a browser extension for Google Chrome that allows you to inspect LWC on the page and see the component’s properties and state, as well as the component’s events and their associated handlers.

One of the most useful features of this extension is the ability to see all the calls to the servers (Actions tab) with sent parameters and return values, as well as errors (if they took place). It has less functionality than Chrome Dev Tools and values from the Actions tab can’t be copied, however, the UI part looks very clear and understandable for beginners. You can find more details and download the extension from the Chrome Web Store.
Online Playgrounds
An online playground is a great way to debug and validate simple Lightning Web Components that don’t have many dependencies on other components. These playgrounds allow developers to experiment with LWC in isolation, without the need to deploy them to a Salesforce org.
Additionally, online playgrounds provide a visual interface for developers to interact with the component, making it easy to see the effects of changes in real time. Overall, online playgrounds are a good solution for debugging LWC code when you need to test a component in isolation or you need a quick way to see the result of your code changes.
Keep in mind that the playground environment may not always match the environment of the actual Salesforce org where the component will be deployed. This can lead to unexpected behavior or errors when the component is deployed to a production org. It’s always good to validate the code in an org and run the test cases.
Here’s one of the playgrounds that is recommended by Salesforce: webcomponents.dev.

Debugging Directly in IDE
There is also an option to debug our LWC code directly from the IDE. You can write Jest tests that will cover the logic and markup of your components. By running these tests directly from the IDE, you can debug code in the context of the Salesforce org where it will be deployed. This means that developers can set breakpoints, step through code, and inspect variables, all without leaving the IDE interface.

As the most popular option, you can debug in Visual Studio Code. Salesforce recommends using VS Code together with the Salesforce Extension Pack. This extension pack is a collection of extensions for the Visual Studio Code editor which provides a set of features for developing Salesforce applications, including LWC. The extension pack includes a Lightning Web Components extension that allows developers to debug LWC code directly from the VS Code editor.
Summary
To sum up, debugging Lightning Web Components (LWC) is an important part of the development process. By using these debugging tools and best practices, developers can streamline the development and maintenance process, simplifying the task of debugging LWC and ensuring that their code is secure and optimized for performance.
If you found this article helpful, I invite you to connect with me on LinkedIn. I am always looking to expand my network and connect with like-minded individuals in the Salesforce area. Additionally, you can also reach out to me for any questions or feedback on the article. I’d be more than happy to engage in a conversation and help out in any way I can. So don’t hesitate to contact me, and let’s connect and learn together!