

Salesforce’s recent announcement of Web Console could be one of the biggest non-AI-focused features that Salesforce has released in a long time. It is free, accessible to everyone, and is incredibly powerful.
Now that the Web Console beta is live, let’s dive in and learn all about it – how to set it up, how to use it for various key functions, and what the tool is designed to do and not do.
Why Does the Web Console Exist?
Every time a new preview release of Salesforce comes out, one of the first things I check is the Developer Console. No matter what kind of project I am working on, the Developer Console is a valuable tool for me. However, it saddens me how little support there is for newer tools and technologies (or design standards for that matter).
I was pleasantly surprised when Salesforce made the announcement that they were releasing a new tool called Web Console that will sit somewhere between Developer Console (and the unofficial Workbench tool) and Agentforce Vibes IDE. Salesforce says that Web Console is a lightweight, browser-based IDE that is readily available inside Salesforce. Their intent is for this tool to deliver a high-performance, cost-effective tooling for agile, in-context workflows.
To answer a common question: no, Web Console does not directly replace Developer Console, or any tool for that matter. It serves a unique purpose, and as such is its own self-contained tool.
Currently in beta, the goal is simple – Salesforce wants to empower developers so that they do not have to leave Salesforce to build Salesforce apps. They’re returning to their no-software roots and introducing this browser tool for everyone.
Enabling Web Console
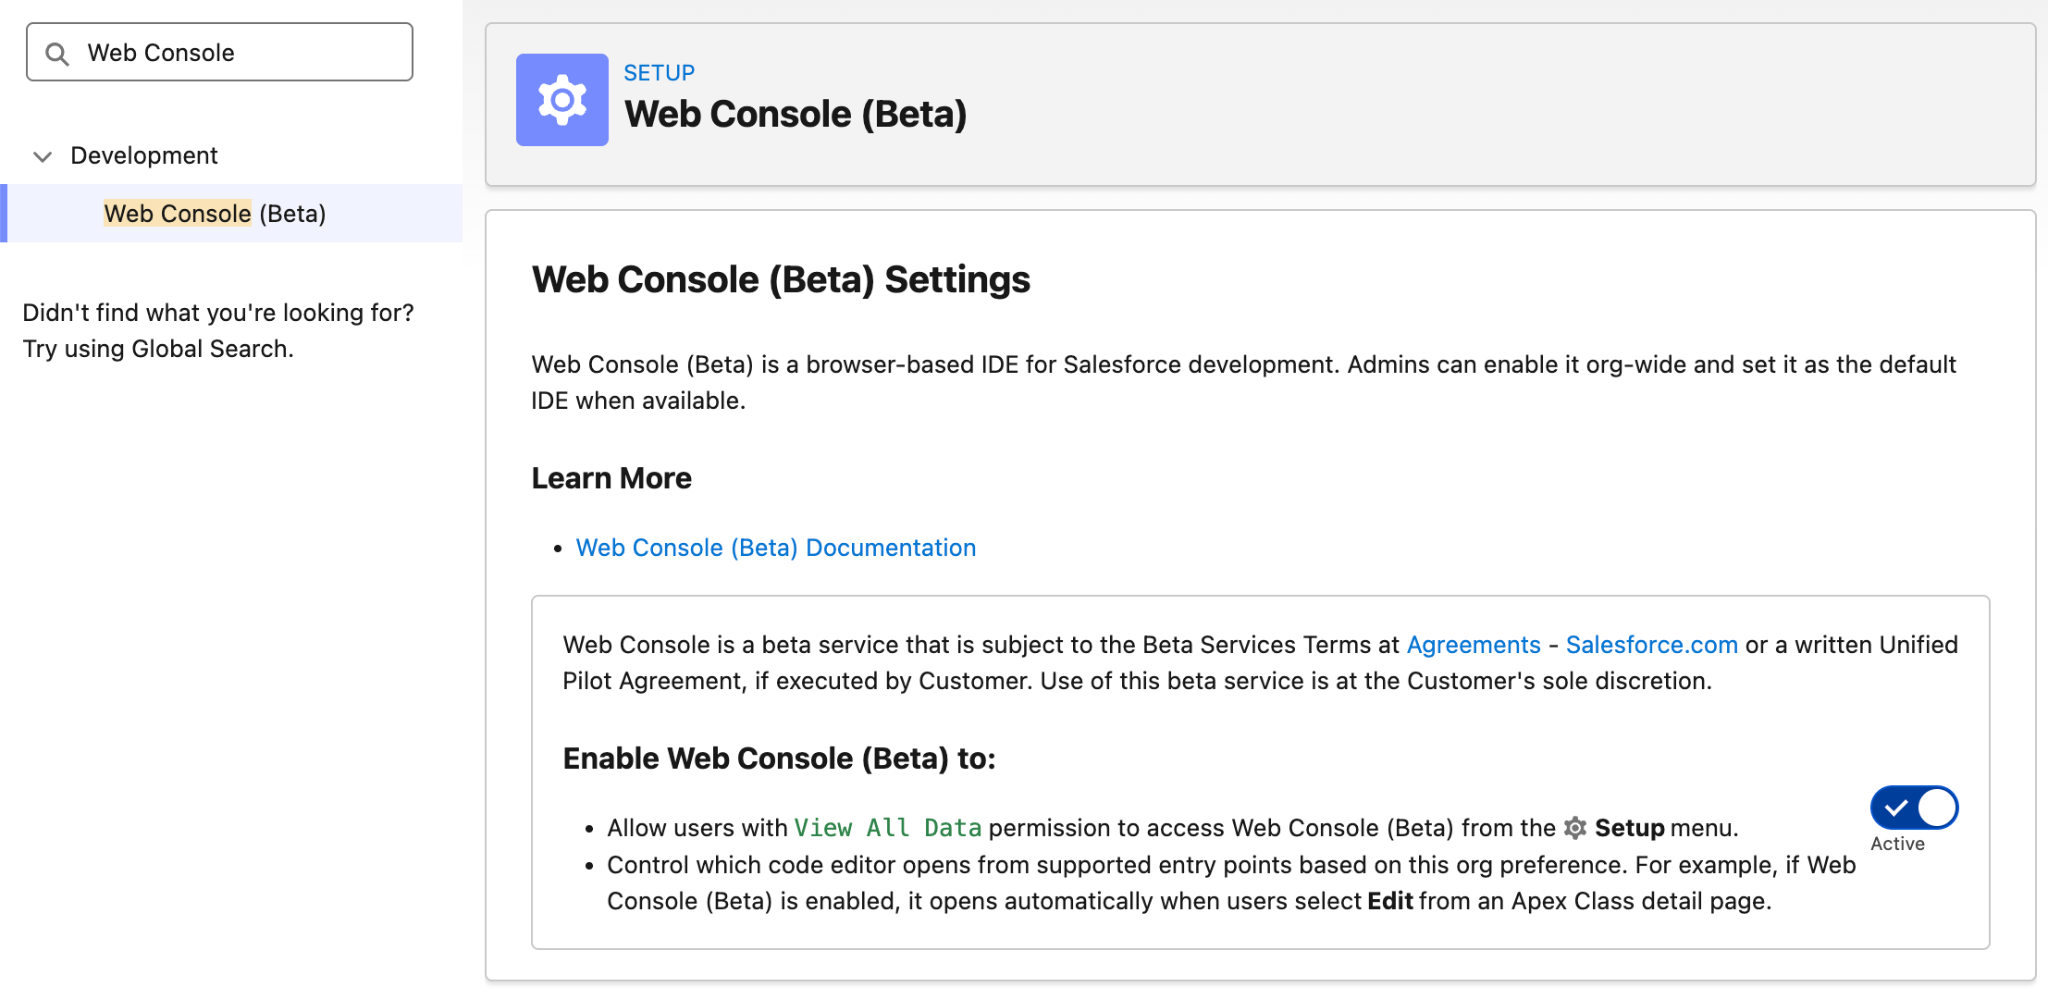
During the beta period, Web Console is disabled by default. It can be enabled by an admin in the Setup menu. Search for the Web Console (Beta) tab in Setup, and flick the toggle to enable the beta.
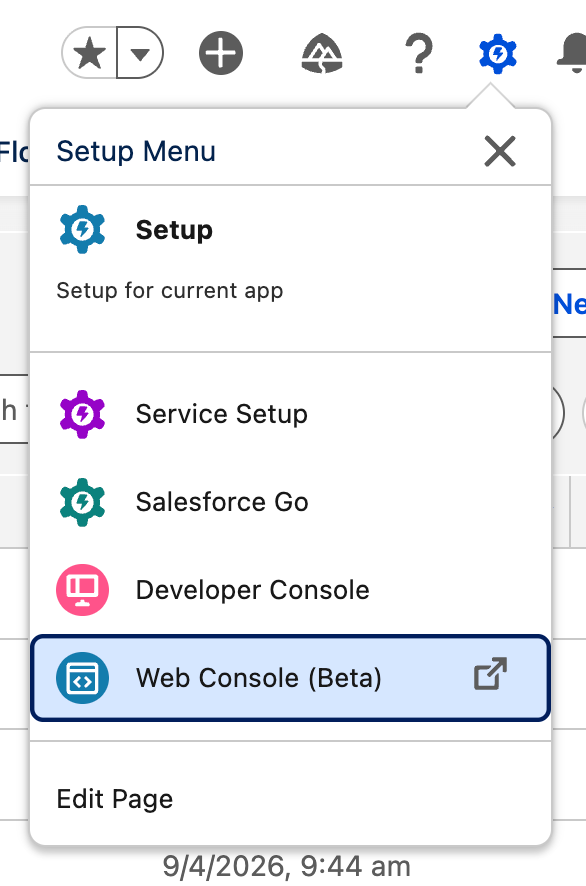
After enabling the feature and refreshing the page, the Web Console will appear in the Setup menu as shown below. As with Developer Console, you can Control-click (or Command-click on Mac) to open it in a new browser tab rather than a pop-up window.
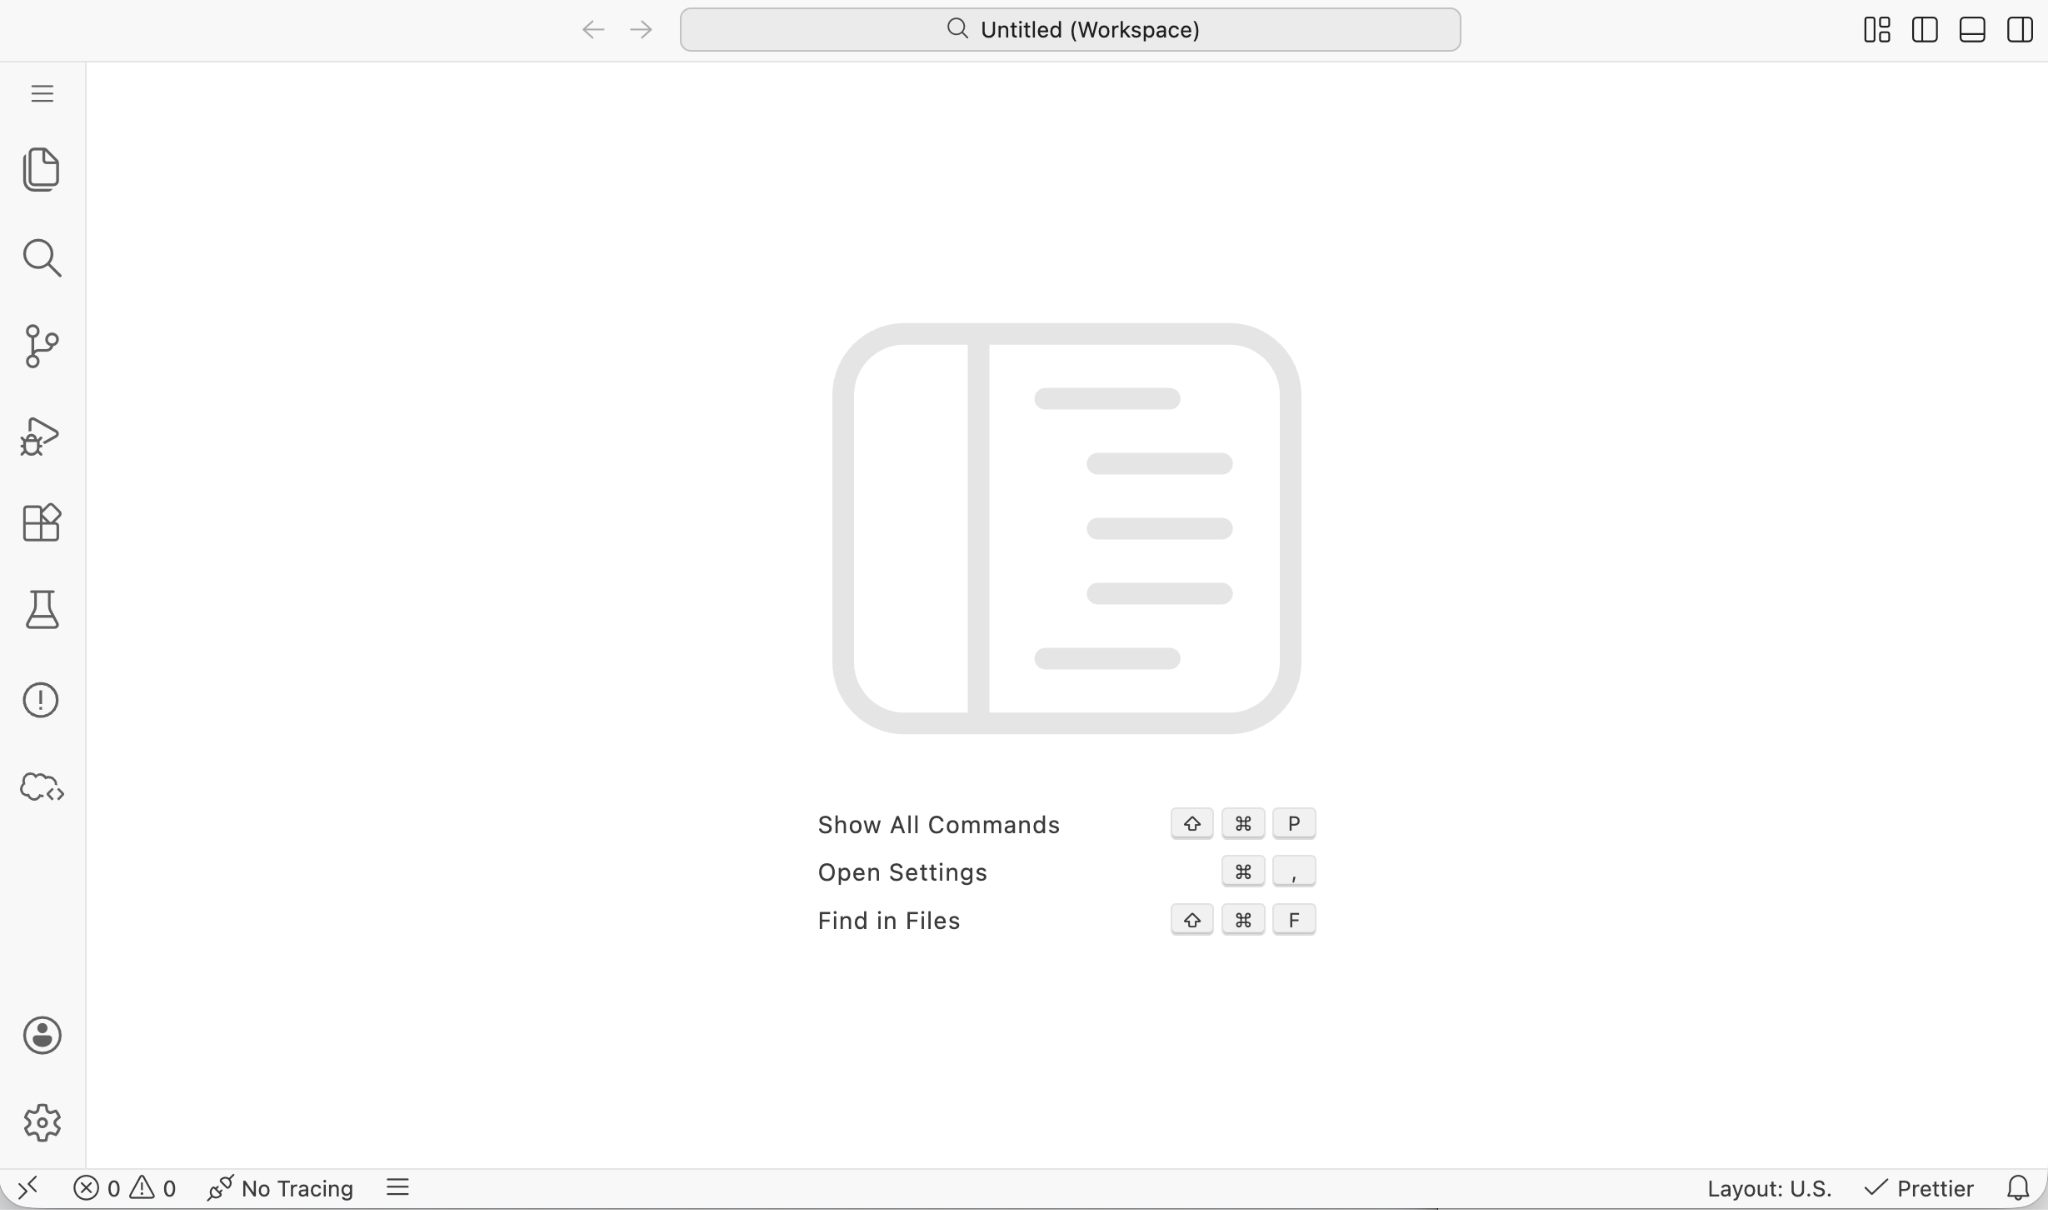
Given how powerful a tool it is, the IDE loads very quickly and feels very familiar if you’ve used other IDE tools like Visual Studio Code.
Using Web Console
Next, we’ll dive into how you can actually take advantage of Web Console in your org. There are a handful of key features that Salesforce has baked into the new tool.
Debugging Code With Logs
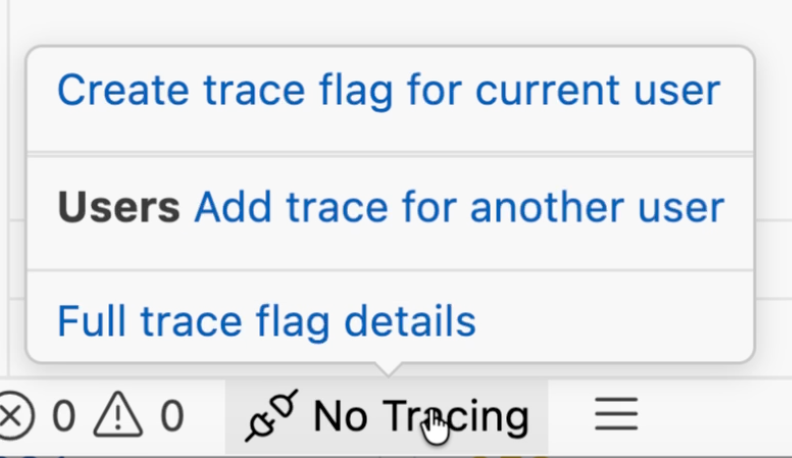
For us to read and work with debug logs in Web Console, we first need to ensure we’re setting up the trace flags in the traceLogs.json file. To create a new traceLogs.json file, hover your mouse over the No Tracing button at the bottom-left of the Web Console, then click Create trace flag for current user. This allows you to begin a debug log for your user with just a few clicks – very snappy!
You can change details about your debug as well by editing the debugLevels values in the lower half of the traceFlags.json file that opens up.
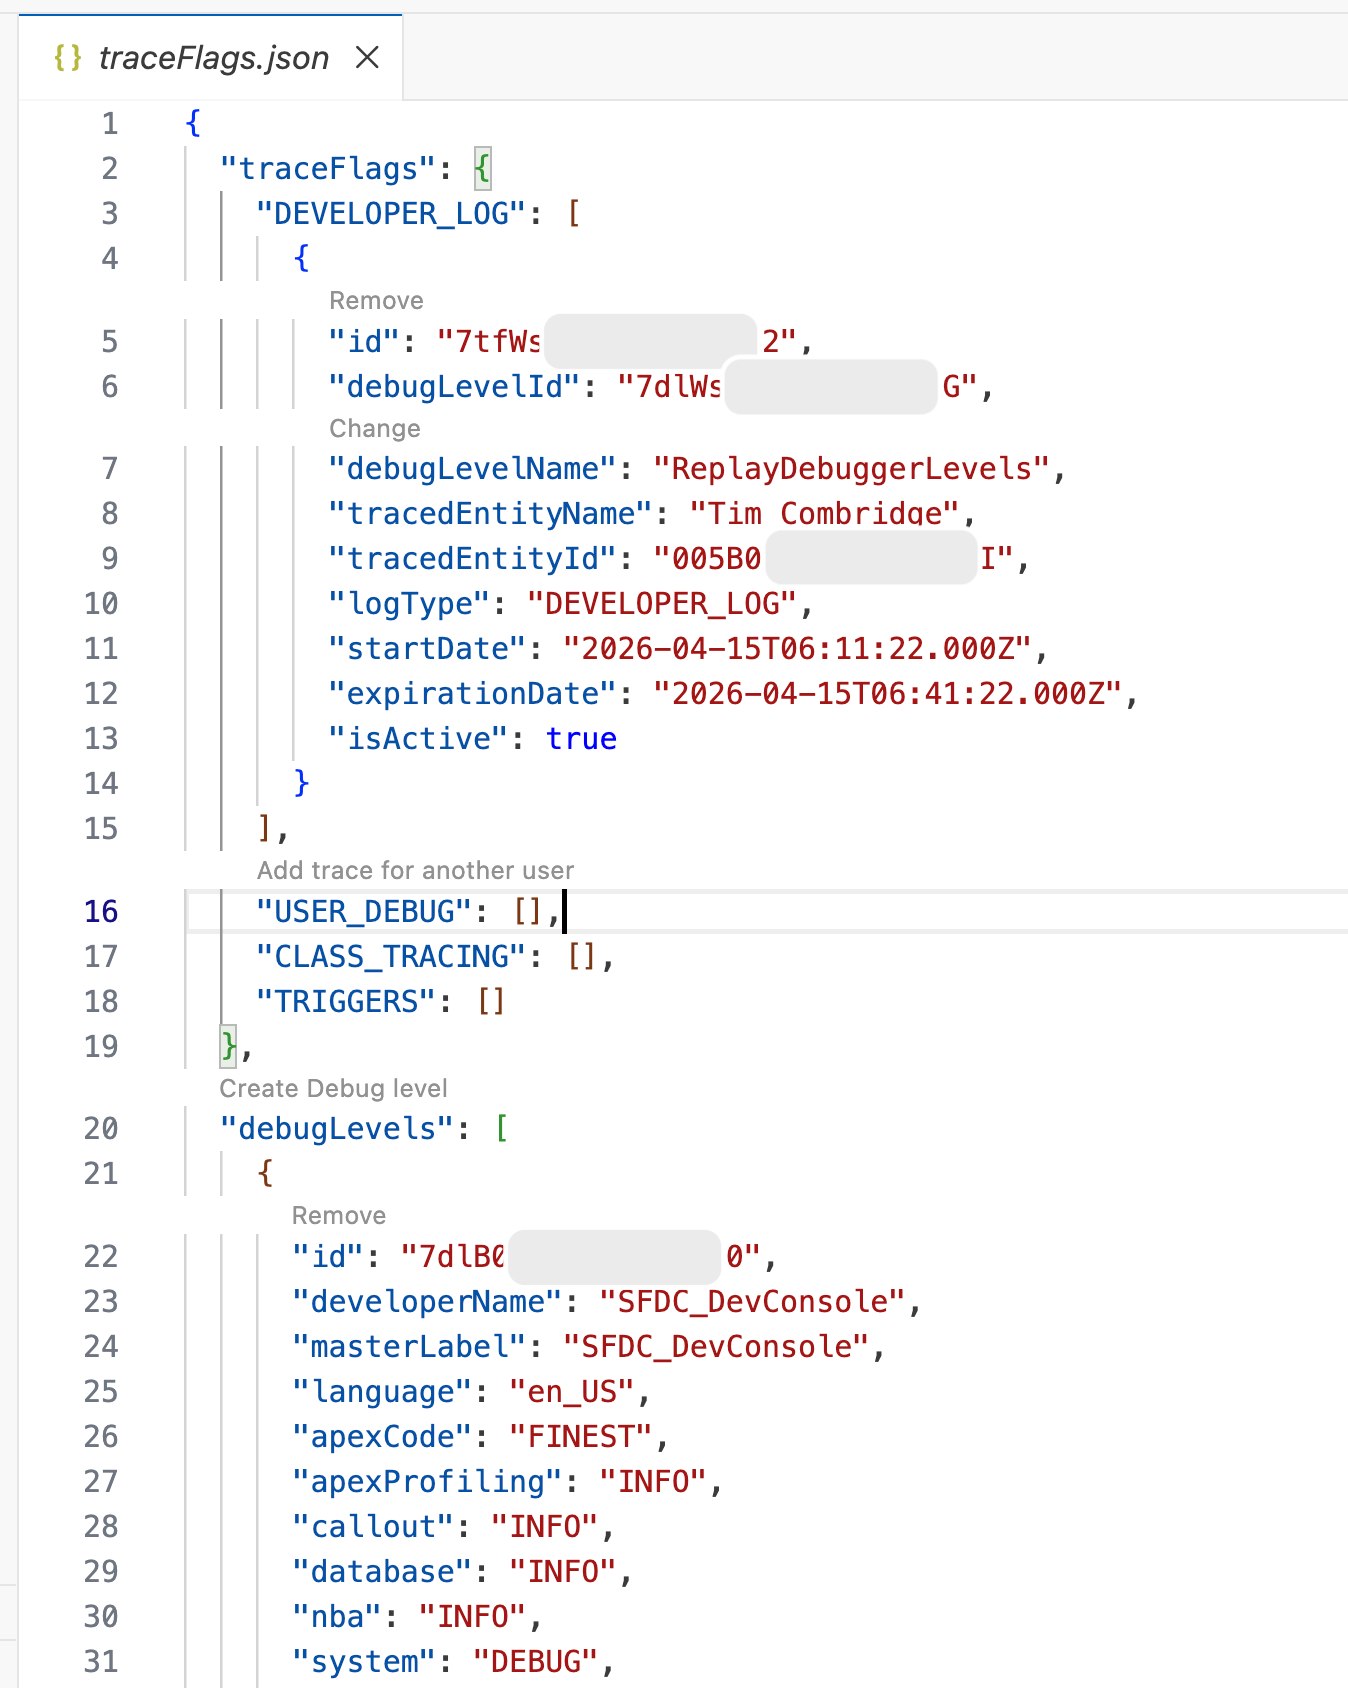
You can change or remove sections in this file to change how your debug logs will operate and who they apply to. Salesforce has made it easy to remove entire sections by clicking the little grey Remove text.
After saving the JSON file, your logs are ready to go, and you can see the current tracing status in the status bar at the bottom left (it will say something like “Tracing until XX:XX” to show you that the log is running, and when to).
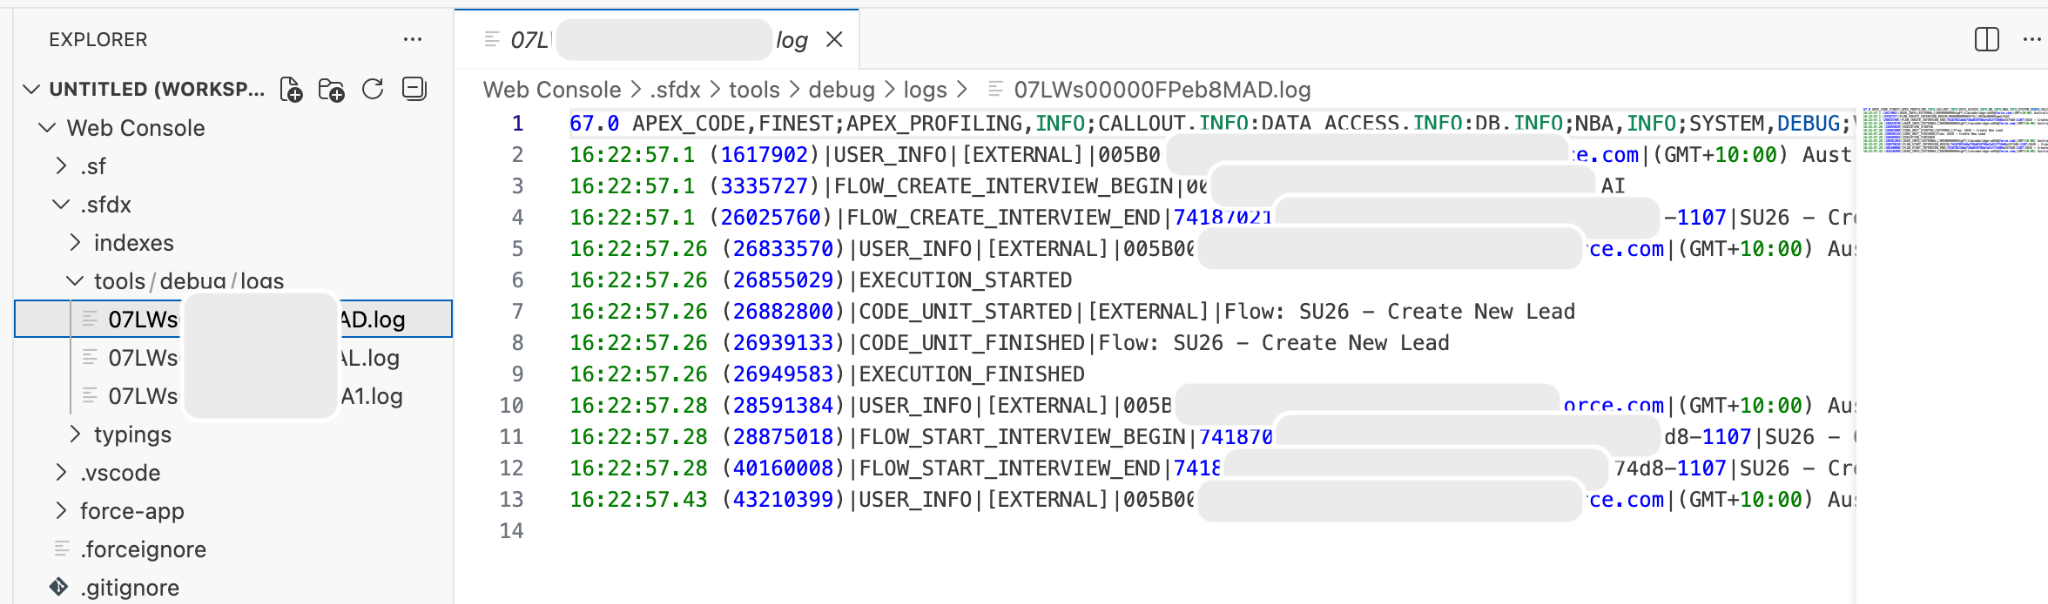
For demonstration purposes, I’ve created a very simple Screen Flow that captures a few fields and creates a Lead record. By running this Flow while the trace is running, I’ve created some logs under the .sfdx/tools/debug/logs folder in Web Console. Expanding one of these, you can see what the log captured and use this to debug further.
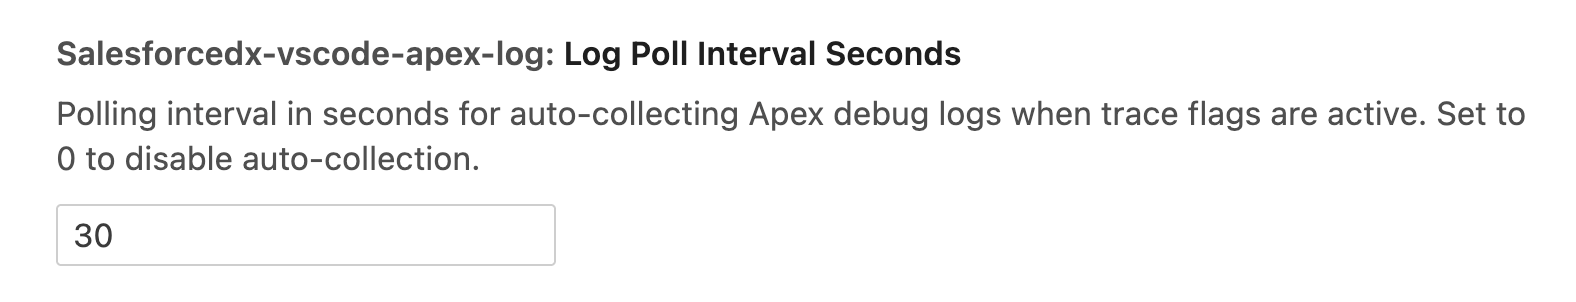
You can choose to manually refresh your project if you want to retrieve new logs immediately, or you can wait until they’re automatically refreshed. The default interval is every 30 seconds, which can be changed in the Web Console Settings (bottom left of the Web Console UI, search for Logs).
Use Org Browser to View and Retrieve Metadata
Given that Web Console is run from within one org, the Org Browser extension will be automatically set up and connected to that org. This makes metadata retrieval much easier, as you don’t need to authenticate a new org or ensure you’re pulling from the right org – it’s all right there, ready to go.
Simply click the icon to open up Org Browser and begin work.

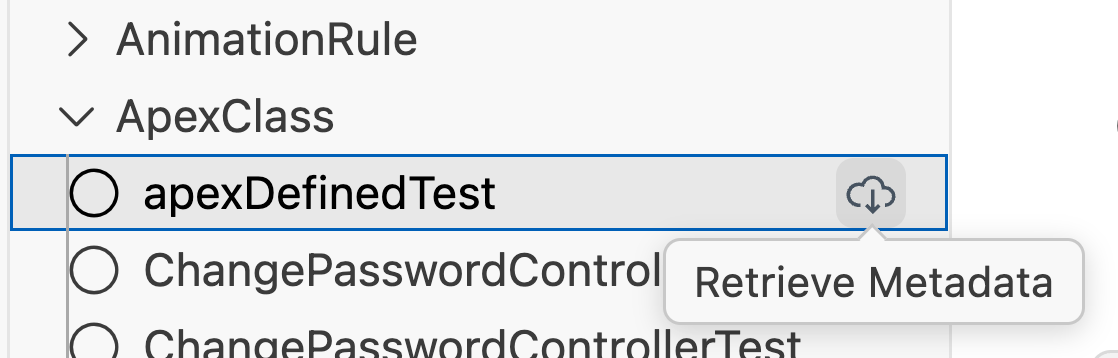
From here, you can view all of the metadata in the org that you have access to. You can also choose to retrieve metadata into your working project so that you can work with it. You can do this by clicking the retrieve icon next to each item.
Query Records from Org
Next up, we’re going to look at the Query Builder that’s built into Web Console. This tool is valuable when you want to use SOQL to retrieve results from the Salesforce database, either to confirm that a SOQL query performs as you expect or to confirm that specific data exists in your system.
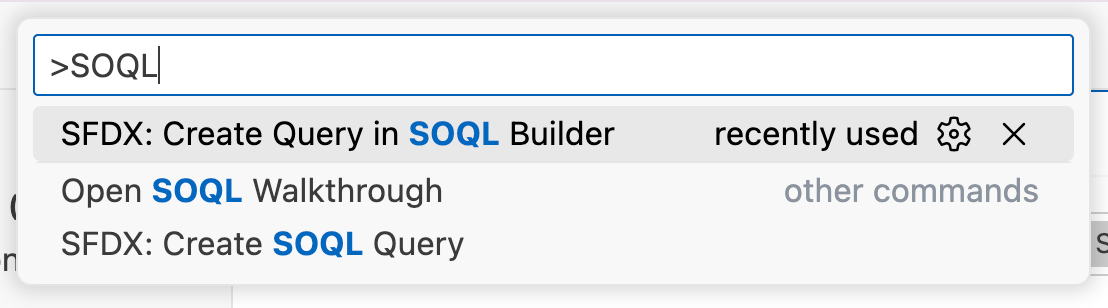
To access the Query Builder, you’ll need to open the Command Palette (Ctrl + Shift + P for Windows, Cmd + Shift + P for macOS) and run the “SFDX: Create Query in SOQL Builder” command.
Then you’ll need to give your query file a name. In this example, I’m going with getSampleLeads.
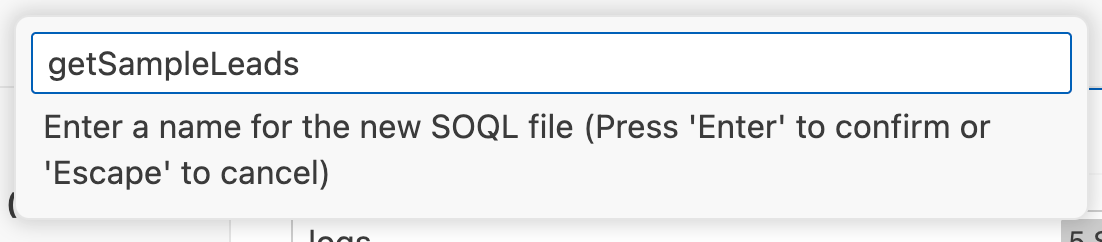
It will then prompt you to set a folder to store the file in, which I left as the default for now. After hitting Enter one last time, my new Query Builder page was displayed.
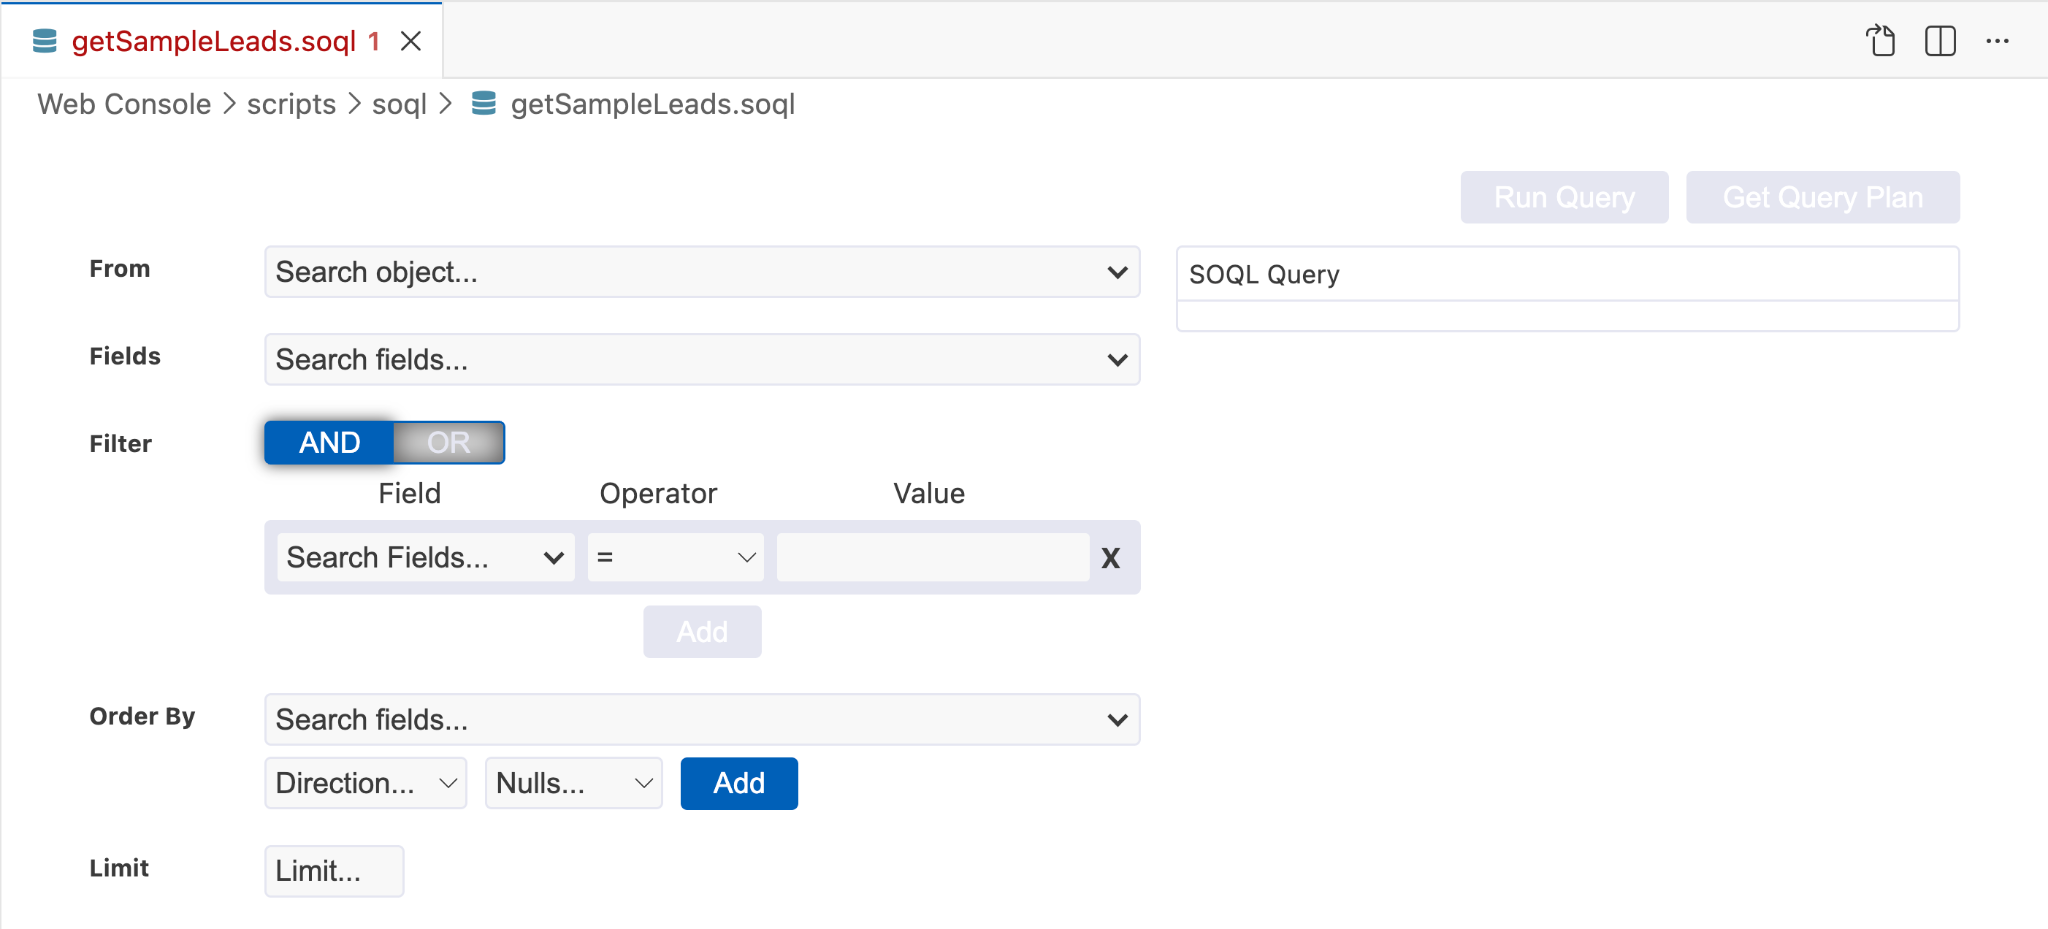
This UI will look very familiar if you’ve ever used a UI-based query tool before. You’ll select your Object (FROM), the Fields you want to retrieve, and there is a section to set your filter criteria, order details, and a row limit.
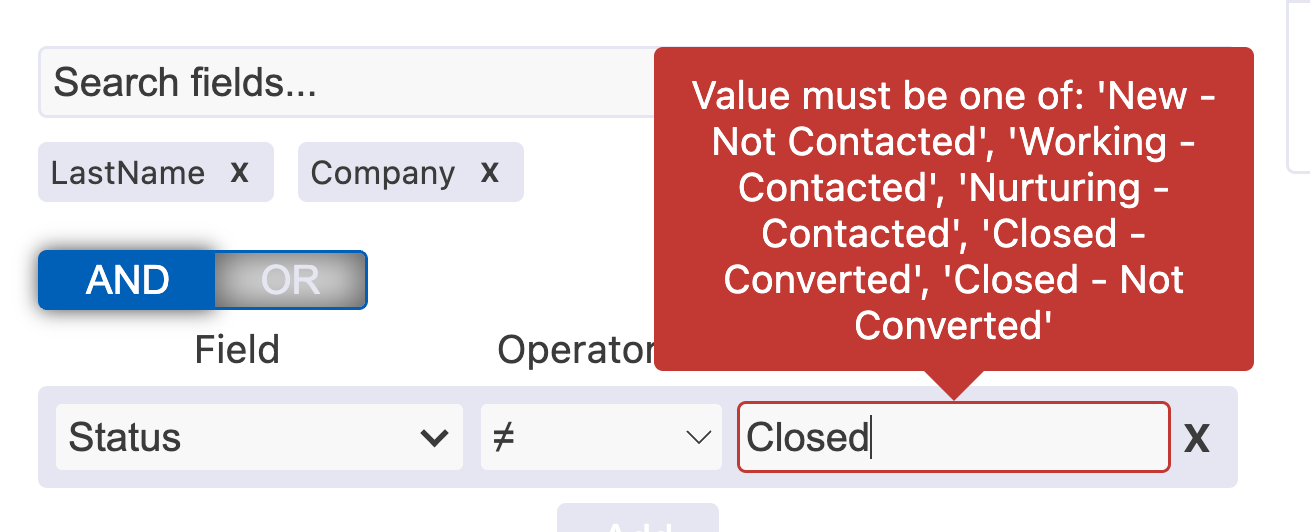
As you make your selections, you’ll see your SOQL query generating dynamically to the right. You’ll also see there are guardrails in place to help you provide accurate values for field filter criteria.
Once you’re done, click Run Query. This will open another tab next to the Query Builder with your results. You can export your records as a CSV or JSON file as well.
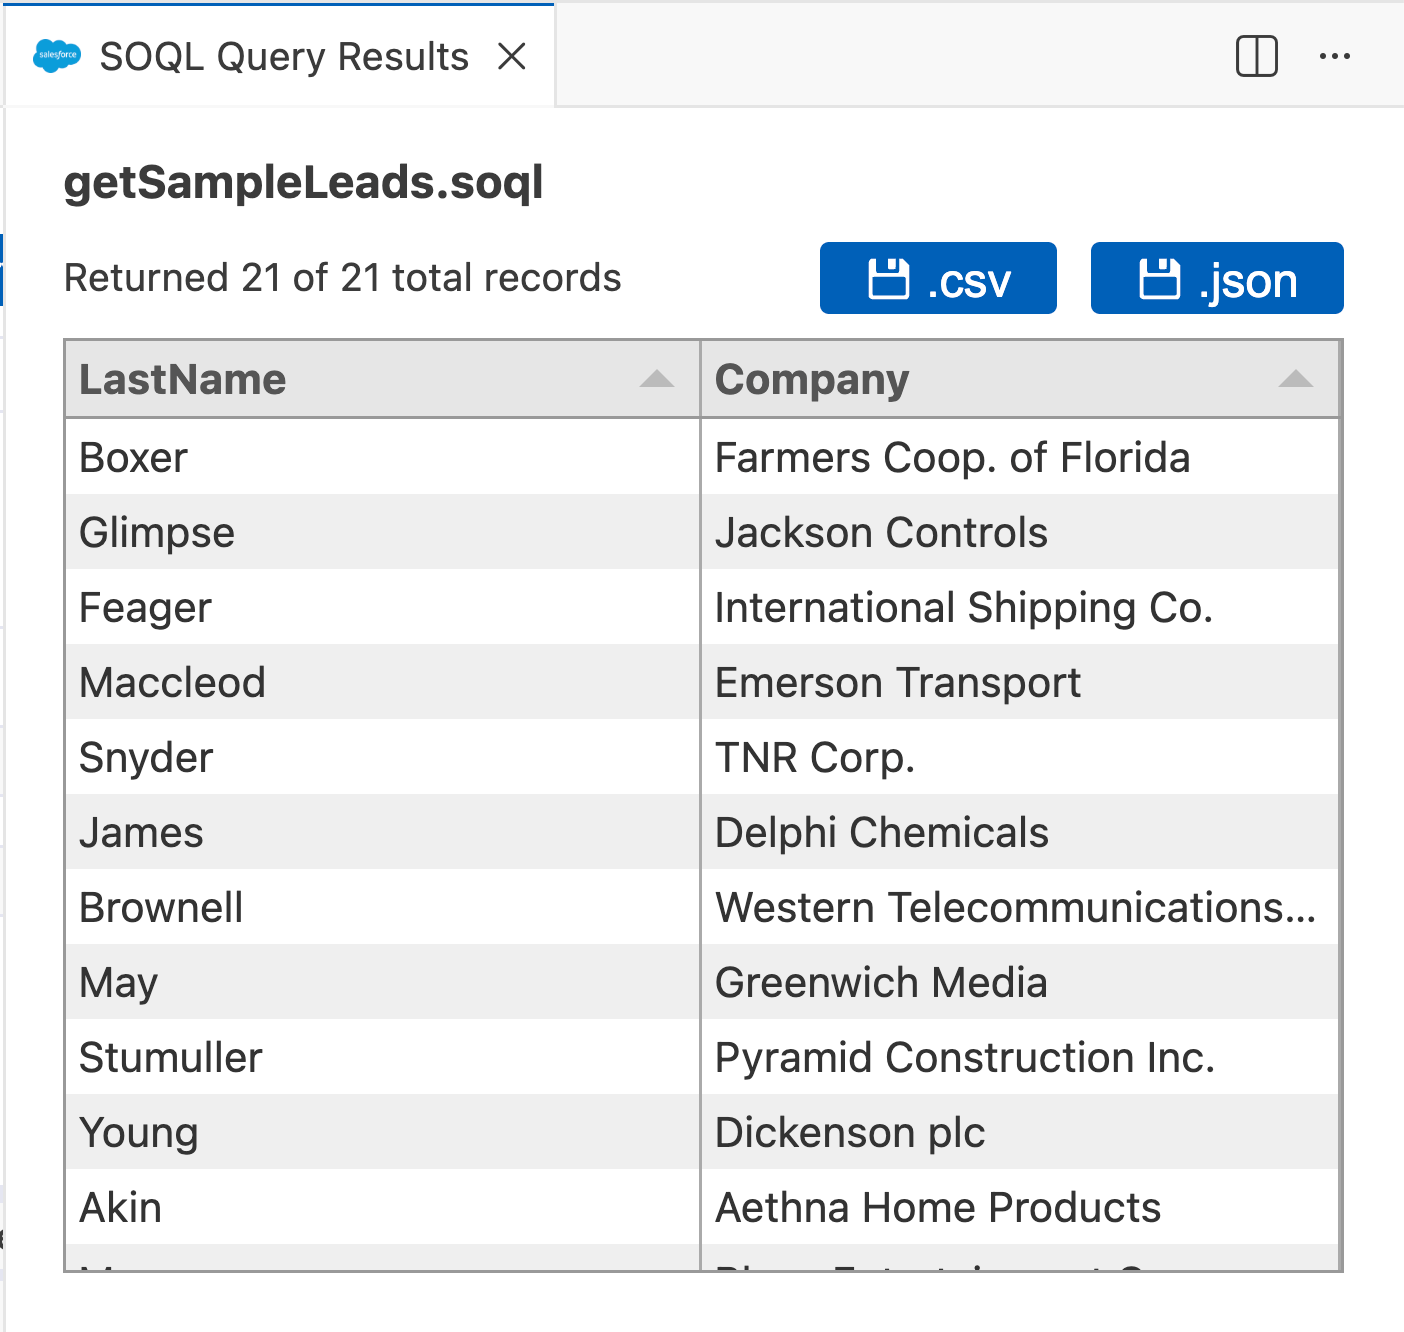
Back on Query Builder, you’ll notice you’ve got the option to export a Query Plan (which is a handy feature to have). Clicking this will generate the Query Plan details in the Terminal.
In addition to the visual Query Builder, you can also run a selected SOQL query by using the SFDX: Execute SOQL query with Currently Selected Text command.
Execute Anonymous Apex Scripts
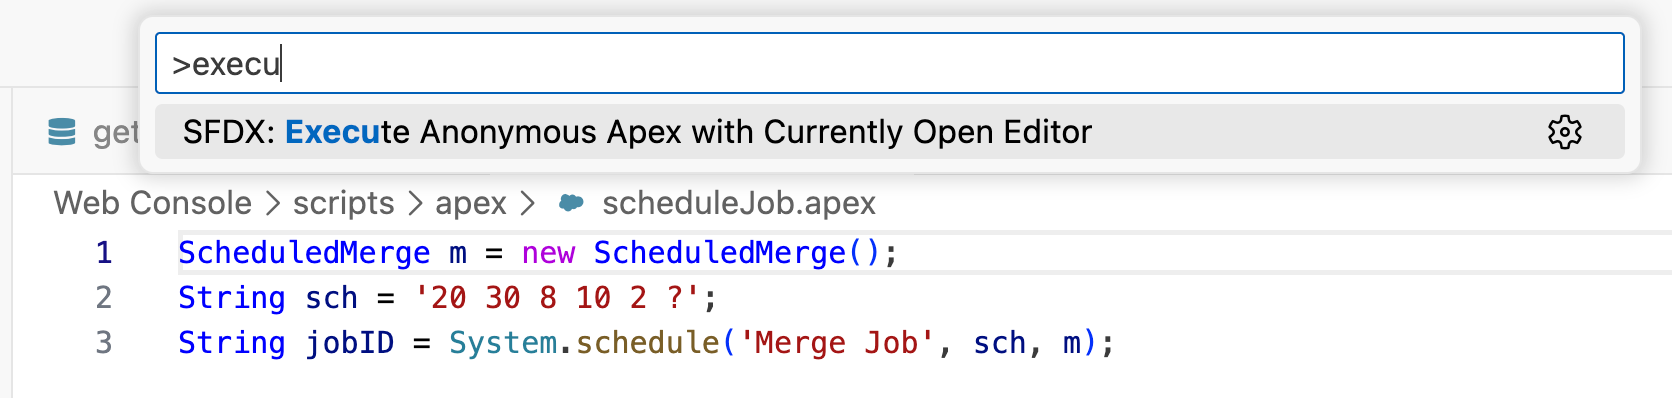
Similar to the Developer Console, you can also run Anonymous Apex code snippets. The process is simple enough, too – open the Command Palette, run the SFDX: Create Anonymous Apex Script command, and modify the sample script in the text editor.
Once you’re ready to execute, simply run the SFDX: Execute Anonymous Apex with Editor’s Selected Text command.
Manage Metadata (Apex, LWC, and Other Metadata)
This is where the fun really begins! Remember at the beginning of this section where I talked about how you can use the Org Browser to retrieve metadata from the org? Well, with Web Console, you can also create new metadata just like you can in a regular IDE.
Aside from Agentforce Vibes (formerly Code Builder), this marks the first time that you can create new Lightning Web Components directly within the browser. It’s about time! A welcome addition, and one that was desperately desired from the Developer Console days.
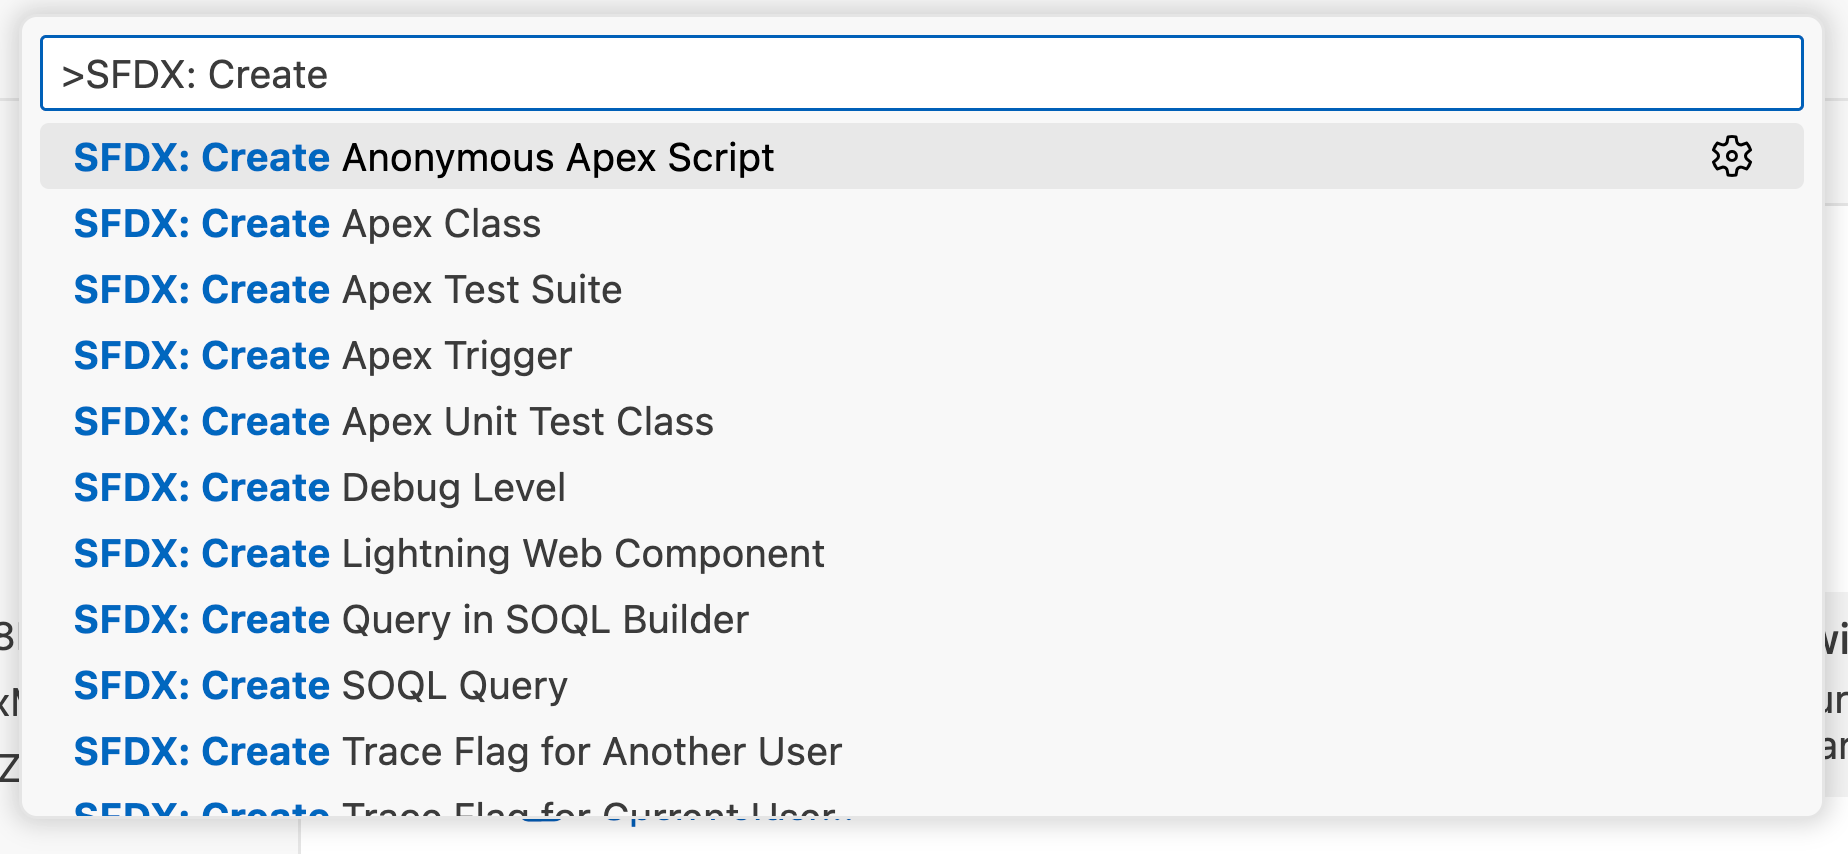
To create new metadata, you will need to run the appropriate command in the Command Palette. Typing SFDX: Create into the Command Palette will let you complete the relevant command, but the key ones you’ll want to keep in mind are:
- SFDX: Create Apex Class
- SFDX: Create Apex Trigger
- SFDX: Create Lightning Web Component
Once the relevant files are generated, you’ll be able to build and test your new metadata as per normal.
Considerations
The biggest point that is worth mentioning is that Agentforce Vibes is NOT Web Console, and vice versa (more on that later). Notably absent is GitHub support or any form of source control, which I will also touch on in the next section.
During the beta period, Web Console is off by default and is only available for these org types:
- US Standard Editions (Developer, Professional, Enterprise, Unlimited, Performance).
- Partner Developer Edition, Government Cloud (GDeveloper, GEnterprise, GUnlimited).
- China Cloud (CNDeveloper Edition, CNEdition, CNEnterprise Edition, CNProfessional Edition).
Web Console preserves the guardrails that have always protected Production environments. For this reason, you cannot directly make changes to Apex and other protected metadata types in Production through Web Console.
What About Agentforce Vibes?
This deserves its own section, and is something Salesforce has addressed specifically, too. Agentforce Vibes (also known as Agentforce IDE, Agentforce Vibes Web, and formerly known as Code Builder) is something Salesforce has been working on and promoting since just before Dreamforce 2025. Many are confused as to why Salesforce is pushing yet another IDE tool in roughly half a year. Does one replace the other? Are they going to merge? What’s the plan?
Salesforce has addressed this question specifically, noting that Web Console is designed to be a lightweight, embedded utility, while the Agentforce IDE is a heavier, full-scale, cloud-based VS Code IDE instance. Web Console is going to be available to everyone – including Free and Starter orgs – whereas Agentforce IDE is limited to Professional, Enterprise, Unlimited, and Developer Orgs.
Web Console’s purpose is to provide developers with a tool that they can use for fast, in-context troubleshooting. Agentforce IDE is designed for larger development and includes support for GitHub and other source control tools.
The biggest difference between the two is that Agentforce IDE includes AI coding tools (Agentforce Vibes), whereas Web Console requires full, manual, organic development.
If you’ve been paying attention, you’ll notice that all the commands that we ran in the Command Palette above were using the SFDX namespace, not the newer SF. This is because the Web Console does not support the Salesforce CLI, whereas the Agentforce IDE (as a heavier tool) does.
Summary
Web Console is a game-changer when it comes to lightweight metadata modification in Salesforce. It’s the fresh new face for Developer Console that many of us have been holding out for, while not directly replacing it. It also adopts a handful of new tools and provides a lightweight IDE experience for developers.
What are your thoughts on Web Console? Is it something you can see yourself using in your org, or are you still a bit confused as to its place in the browser-based IDE space?