

In modern Salesforce environments, understanding application behavior is essential for maintaining system performance, debugging issues, and optimizing Apex code. Debug logs are a treasure trove of operational insights, but they are also notoriously dense and time-consuming to read.
This is where the AI-Powered Logs Analyzer pipeline comes into play. Designed as a fully automated GitHub Actions workflow, it connects to your Salesforce org, retrieves relevant debug logs, and analyzes them with a locally-hosted AI model from Ollama. The result is a concise, structured report that highlights problems, performance bottlenecks, and coding anti-patterns; all without manual log inspection.
The Hidden Cost of the Traditional Salesforce Debugging
Every Salesforce Developer knows the pain: a user reports slow performance, an unexpected error occurs in production, or worse, silent failures that go unnoticed until they compound into major issues. The traditional debugging approach involves:
- Manual Log Collection: Developers manually navigate to the Developer Console or Setup menu to download individual debug logs.
- Time-Intensive Analysis: Hours spent reading through verbose log outputs, searching for relevant error messages or performance indicators.
- Pattern Recognition Overhead: Analysts must mentally correlate issues across multiple logs to identify systemic problems.
- Reactive Approach: Problems are only investigated after they’re reported by users.
- Limited Scale: Manual analysis doesn’t scale beyond a few logs at a time.
A CI/CD Solution for Intelligent Salesforce Log Review
This article dives into a fully automated GitHub Actions pipeline designed to revolutionize how Salesforce teams handle debug log analysis. The workflow seamlessly:
- Retrieves recent Apex debug logs from a Salesforce org.
- Downloads and organizes them for processing.
- Analyzes the logs using a local large language model (LLM) via Ollama while ensuring no sensitive data leaves the environment.
- Identifies critical issues such as errors, performance bottlenecks, governor limit usage, and common code anti-patterns.
- Generates a clear, structured markdown report summarizing the findings.
- Uploads the report as a pipeline artifact for easy access.
Built with security and privacy at its core, this solution keeps all data within the GitHub Actions runner without sending sensitive log data to external APIs.
Core Technologies Powering the Log Analysis Pipeline
To understand how this pipeline delivers intelligent, secure, and automated insights from Salesforce debug logs, let us explore the key technologies that form its foundation:
CI/CD (Continuous Integration and Continuous Delivery/Deployment)
CI/CD is an automated software engineering practice that enables teams to integrate code changes frequently and deploy them reliably. In the context of Salesforce development, CI/CD pipelines help catch issues before they reach production by automating testing, validation, and analysis.
Ollama
Ollama is an open-source platform that allows developers to run large language models (LLMs) locally with minimal setup. It supports models like “mistral”, “mistral:instruct”, and others through a simple command-line interface and REST API. By hosting the LLM on the same runner as the pipeline, Ollama ensures that sensitive debug logs never leave the secure environment, eliminating data privacy risks associated with cloud-based AI services.
Key advantages:
- Data Sovereignty: Logs are analyzed entirely in-memory, with no external data transmission to an LLM or agent API provider.
- Offline Operation: Once the model is downloaded, no internet connection is required.
- Developer Flexibility: Easy integration into scripts and automation tools.
Mistral
Mistral is an open-source large language model developed by Mistral AI, optimized for reasoning, code comprehension, and structured output generation. In this pipeline, it acts as an AI-powered log analyst, parsing complex Salesforce debug logs and extracting meaningful insights.
Why Mistral fits perfectly:
- Strong Reasoning Capabilities: Accurately interprets log patterns, timestamps, and error hierarchies.
- Efficient Inference: Runs quickly even on modest hardware, making it ideal for time-sensitive CI/CD jobs.
- Instruction-Tuned Variants: Follows prompts precisely while ensuring consistent markdown formatting and rule adherence.
- MIT License: Free to use and modify, supporting long-term sustainability without vendor lock-in.
Mistral is prompted to:
- Identify errors, performance bottlenecks, and governor limit usage.
- Detect anti-patterns such as SOQL or DML operations inside loops.
- Output findings in a clean, structured markdown table.
- Reference source log files for traceability.
By combining Mistral’s intelligence with strict output constraints, the pipeline transforms raw, unstructured logs into actionable, developer-ready reports all within minutes and without compromising security.
The Solution Architecture
Join us to explore how this pipeline works and why it represents an advancement in the future of Salesforce DevOps.
Overview
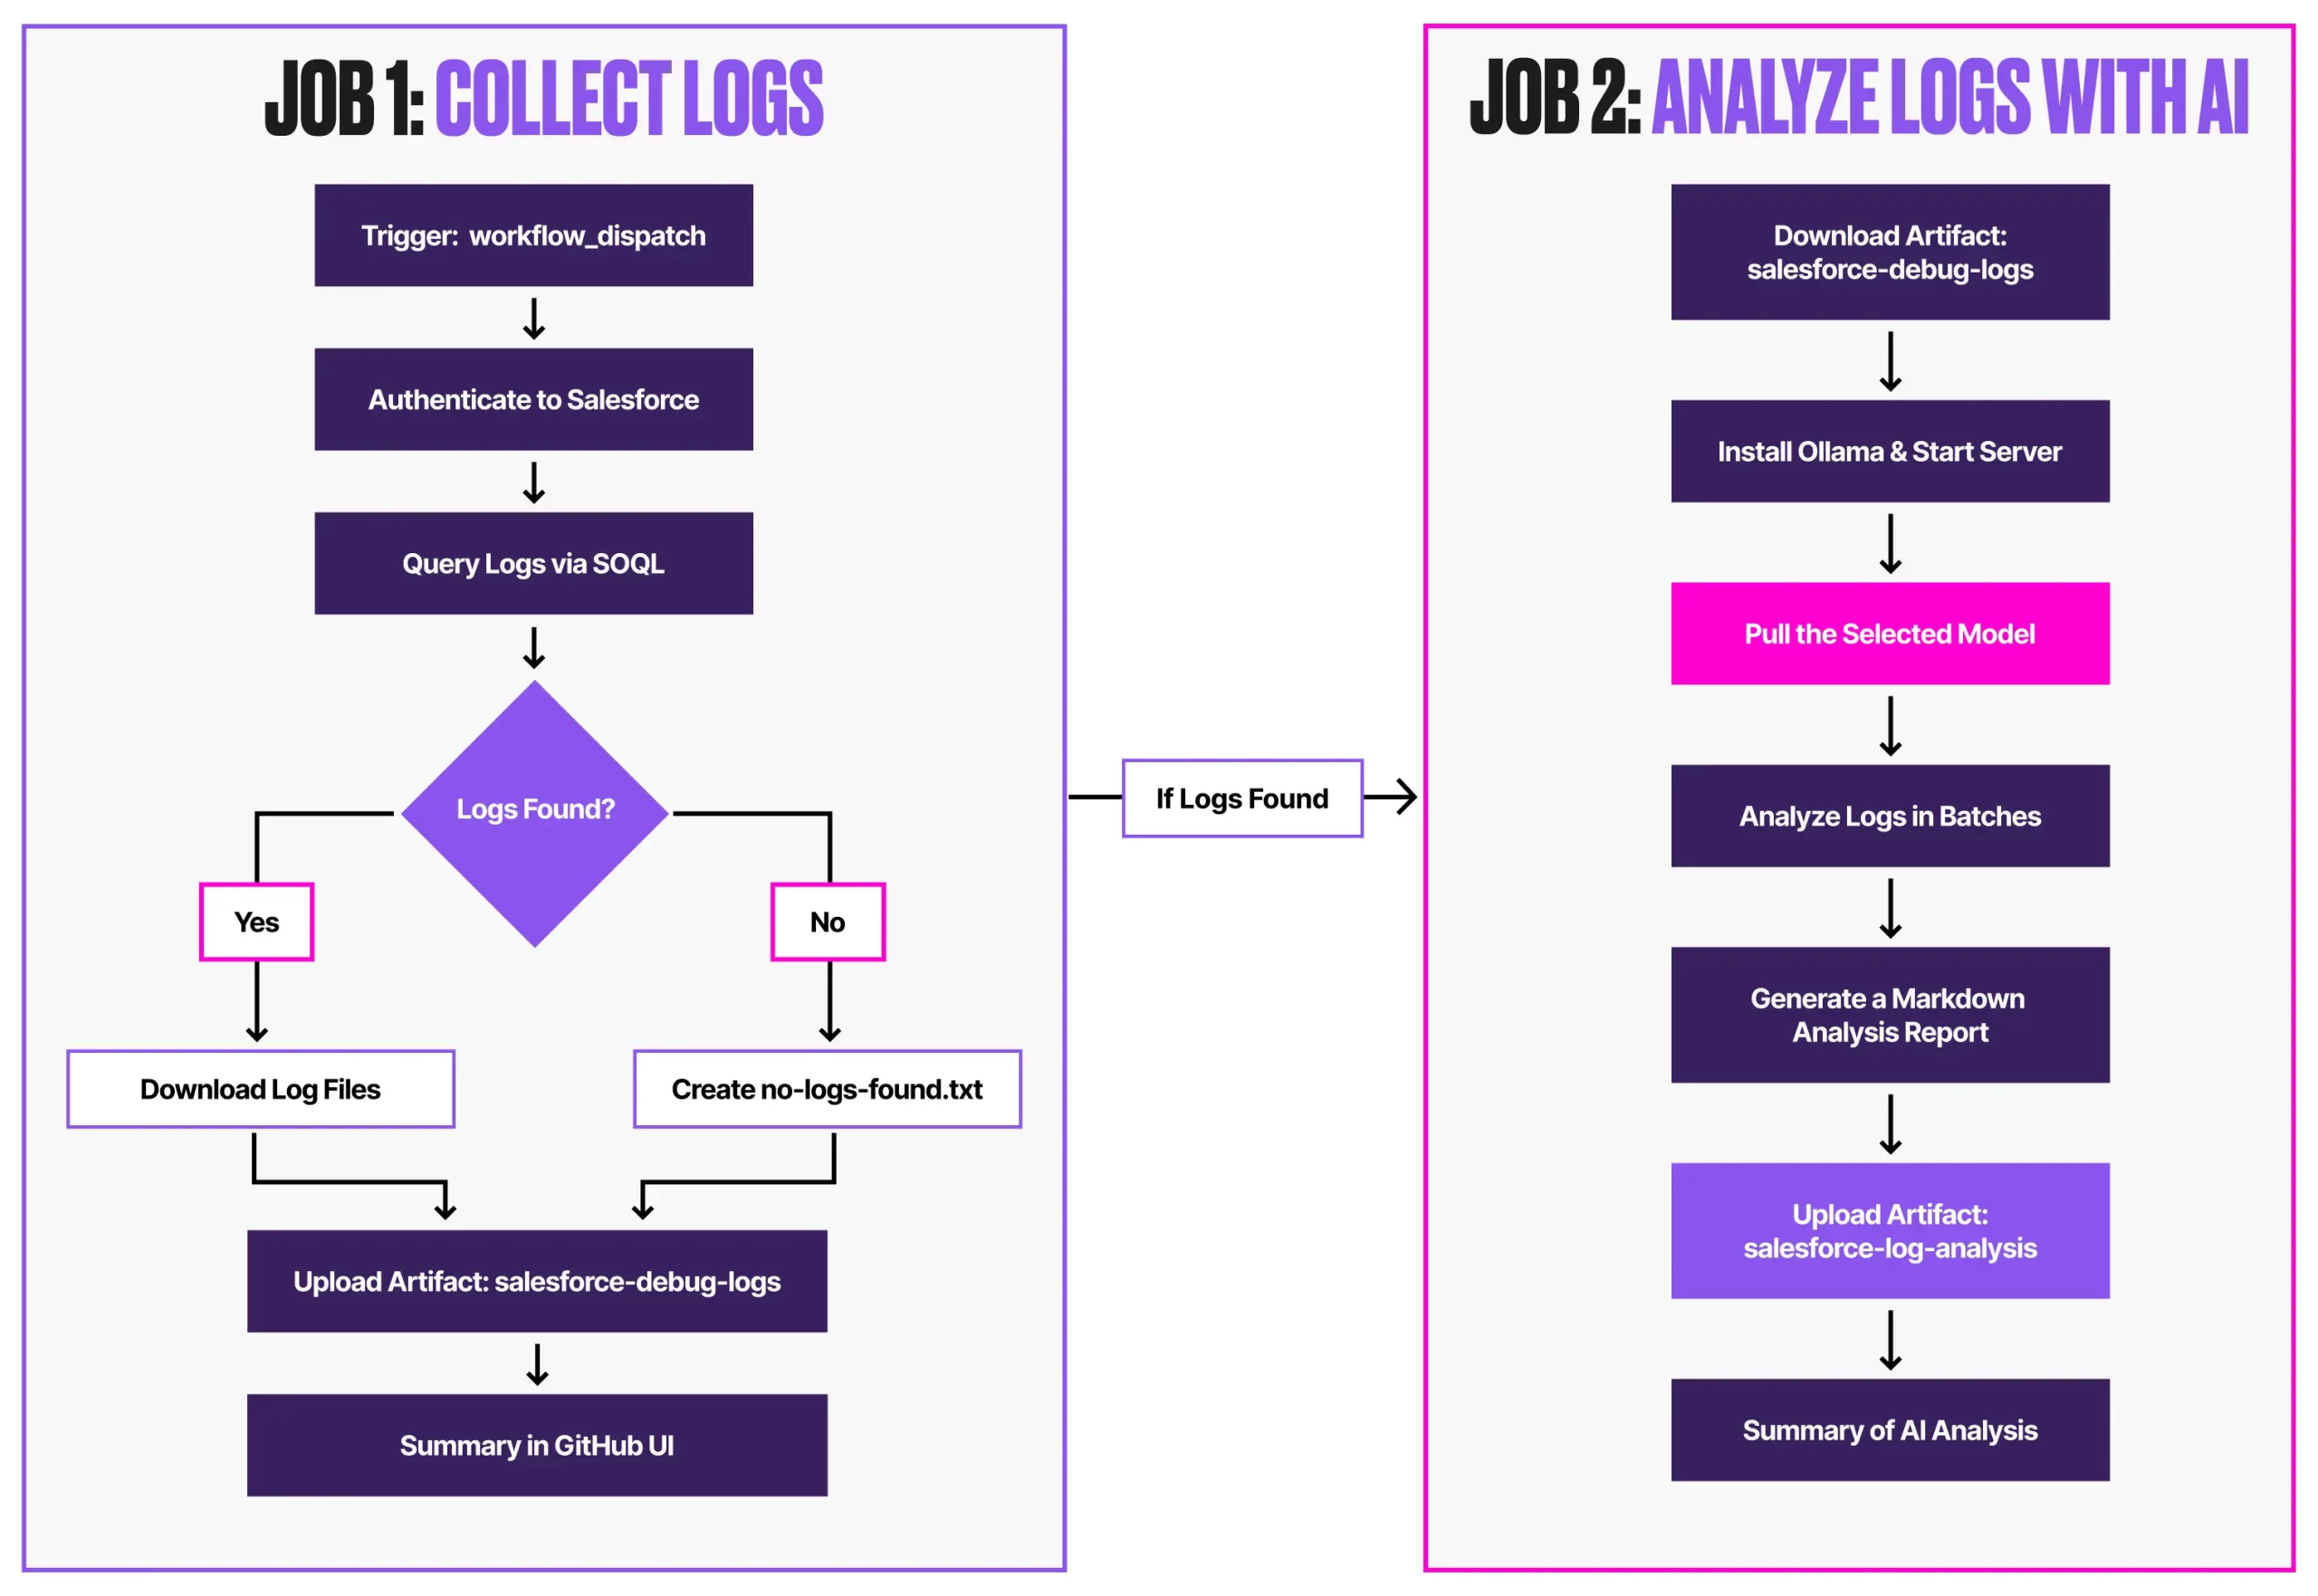
This workflow is initiated manually and runs in two sequential jobs:
collect-logs: Queries Salesforce, downloads logs, and uploads them as artifacts.analyze-logs: Uses Ollama to run AI analysis in batches, producing a structured report.
Prerequisites
Before implementing the pipeline, ensure these critical components are prepared:
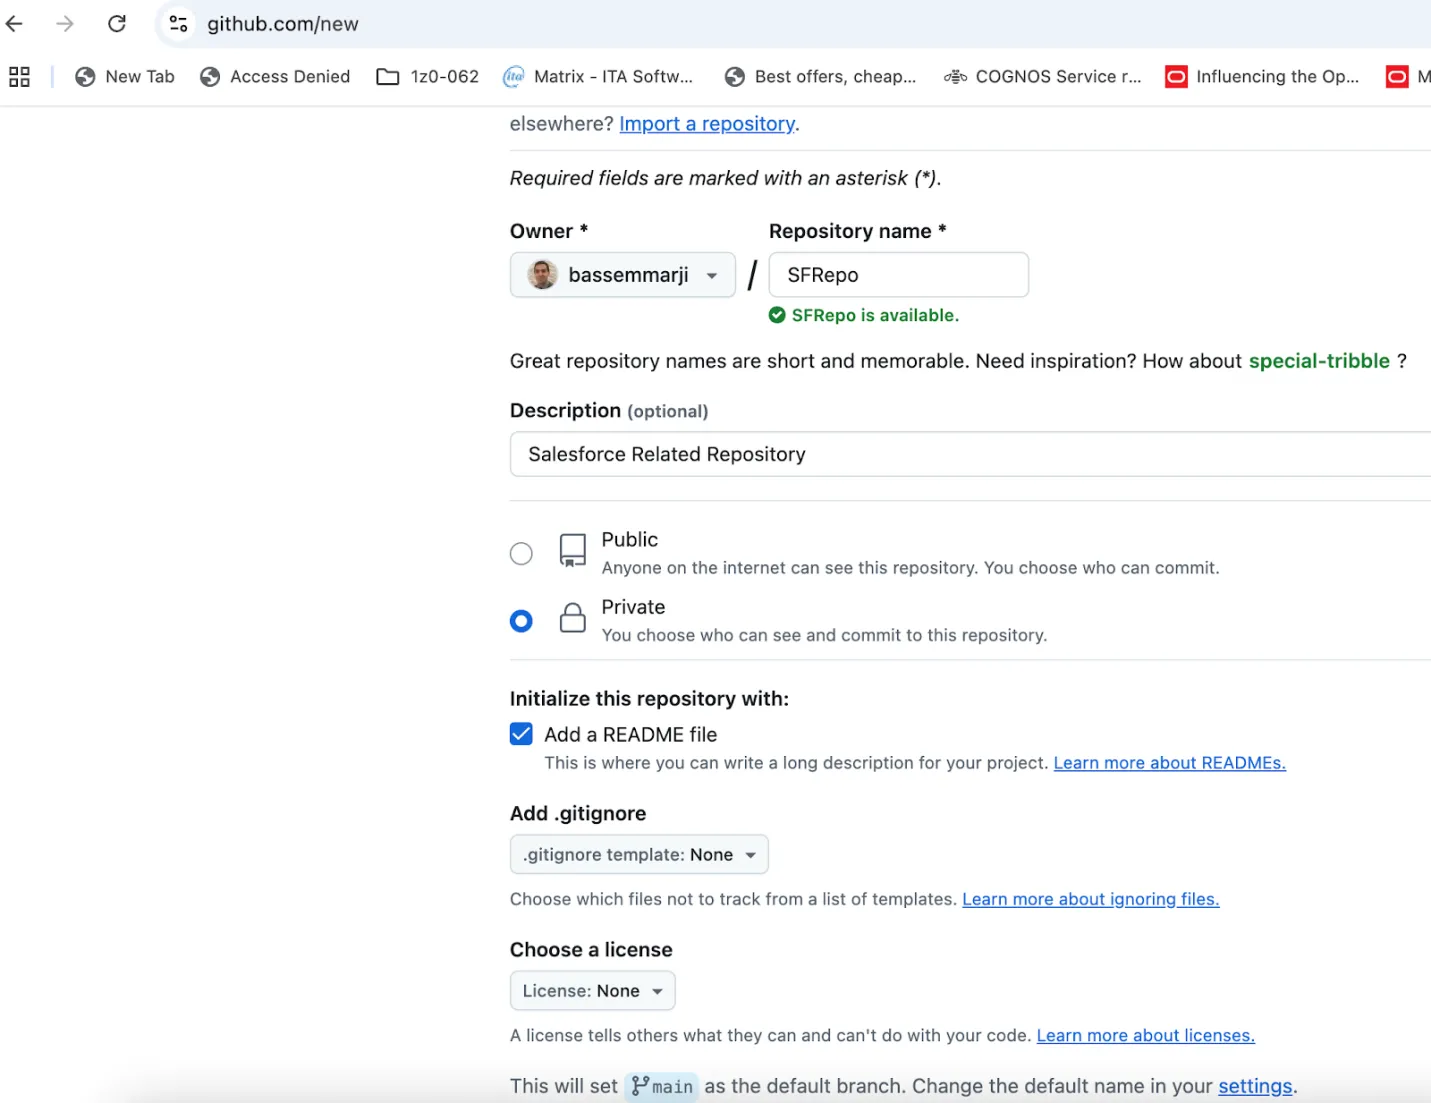
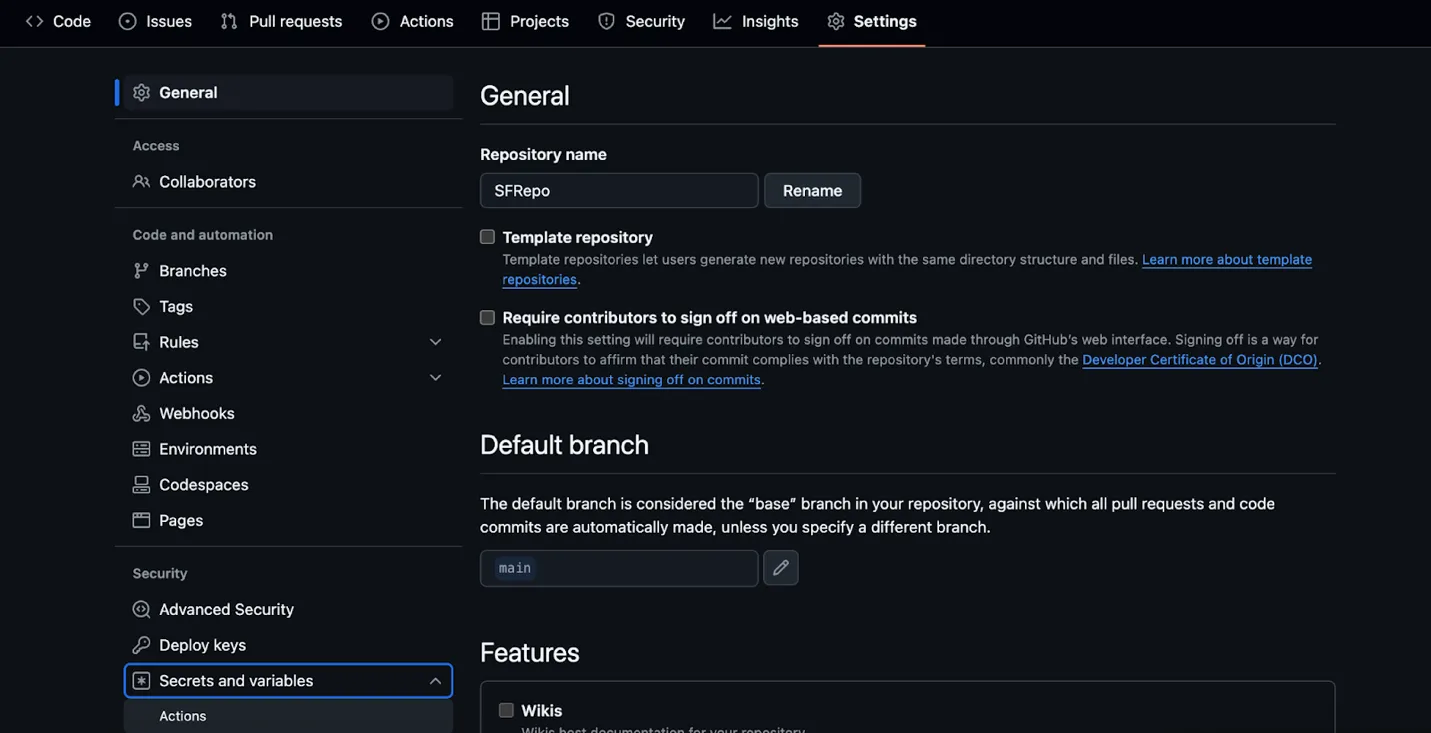
- GitHub Repository: Sign in to GitHub and create a private repository for your Salesforce project as illustrated below.
- Generate Salesforce Authentication URL: With Salesforce CLI installed on your machine, authenticate to your Salesforce org and generate the target org authentication URL by running the following command in your terminal:
> sf force:auth:web:login --alias <OrgAlias> --instance-url <OrgURL> --set-default
Then, follow these steps:
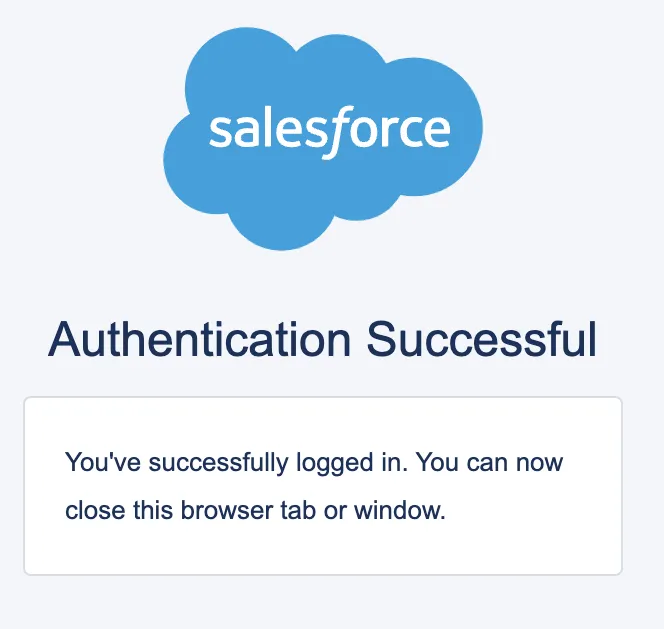
- When the browser opens, log in to Salesforce.
- Close the tab after successful authentication.
- Execute this command in the terminal:
> sf org display --target-org <OrgAlias> --verbose
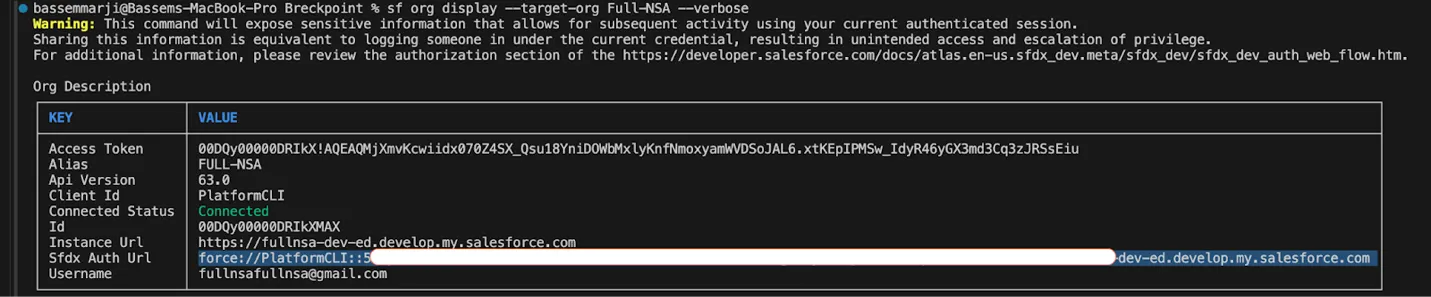
Maintain the value shown after Sfdx Auth Url for later use.
- Critical Security Note: SFDX Auth URLs function as full-access credentials. Treat them as highly sensitive:
- They grant permissions equivalent to the associated Salesforce user.
- Most dev orgs use admin-level profiles (risking total org compromise if leaked).
- Always:
- Use service accounts with least-privilege access.
- Never expose in code, logs, or unsecured locations
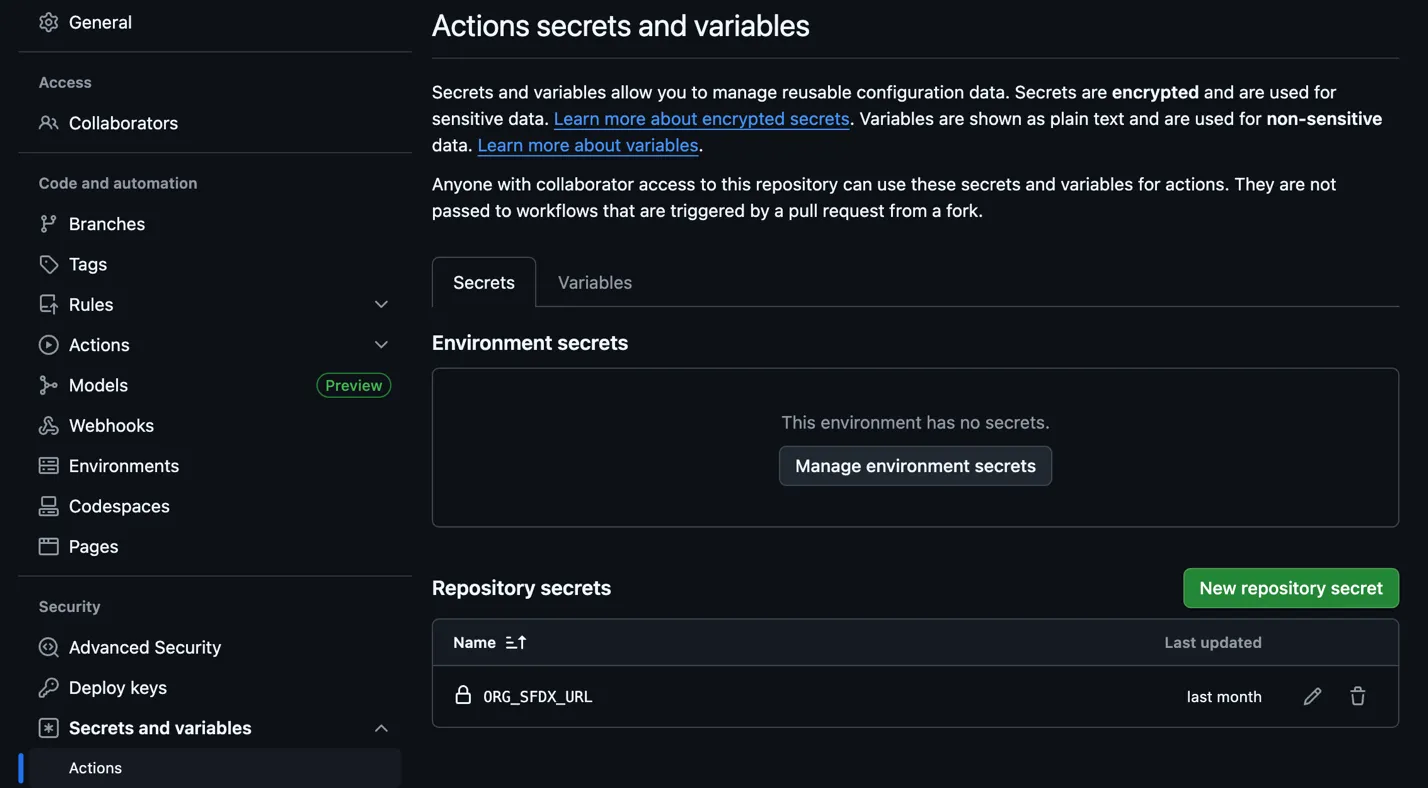
- Store the collected authentication URL in GitHub Secrets:
- Navigate to Repository Settings → Secrets and Variables → Actions
- Select new repository secret and add the following:
- Secret Name: ORG_SFDX_URL
- Description: SFDX authentication URL for your Salesforce org
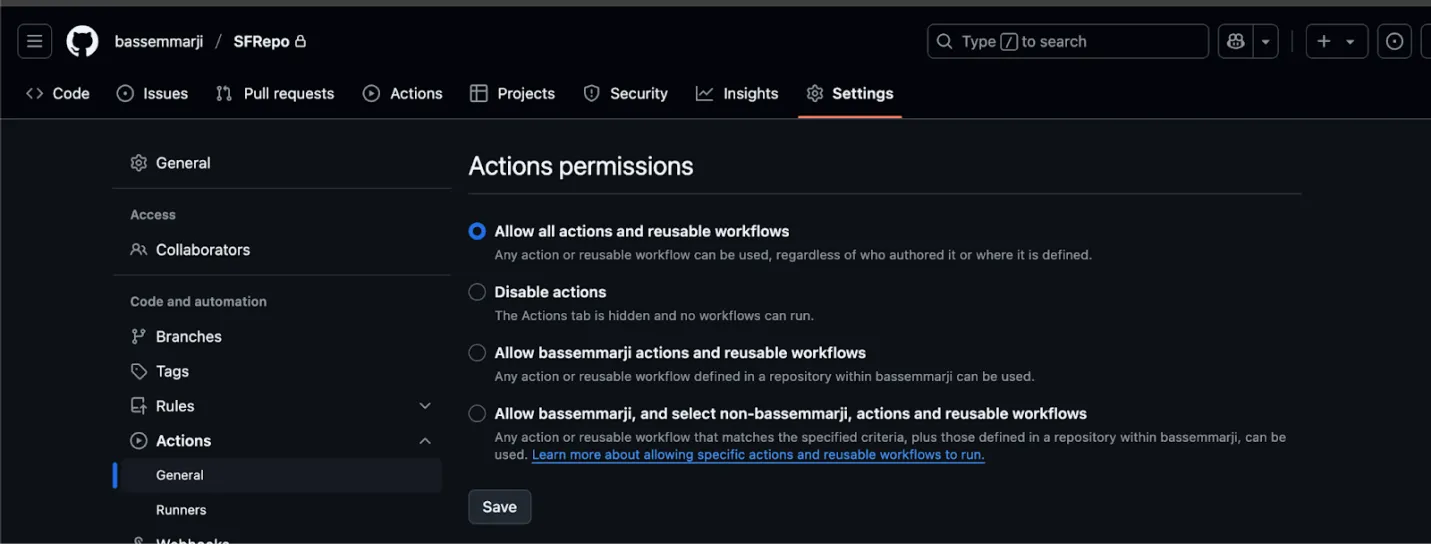
- Enable Workflow Permissions: Ensure that permissions for actions and reusable workflows are granted by enabling the “Allow all actions and reusable workflows” setting:
- Debug Log Execution and Collection: This pipeline analyzes existing debug logs but does not trigger their creation. Salesforce debug logs are only generated when trace flags are proactively configured for users, Apex classes, or triggers before transaction execution.
Implementation
- Create a new file named “LogsAnalyzer.yml” in your repository’s /.github/workflows/ folder.
- Copy the supplied YAML code snippet into the new file.
- Save and commit your changes.
name: AI Powered Logs Analyzer

on:
  workflow_dispatch:
    inputs:
      org_alias:
        type: string
        description: "Salesforce org alias"
        required: true
        default: "dev"
      days_back:
        type: number
        description: "Number of days back to retrieve logs"
        required: true
        default: 7
      model_name:
        type: choice
        description: "Ollama model to use"
        options:
          - mistral
          - mistral:instruct
        default: mistral

env:
  ORG_ALIAS: ${{ github.event.inputs.org_alias }}
  DAYS_BACK: ${{ github.event.inputs.days_back }}
  MODEL_NAME: ${{ github.event.inputs.model_name }}
  NODE_VERSION: "20"
  LOG_DIR: "sf-logs"

jobs:
  collect-logs:
    name: Setup Environment & Collect Logs
    runs-on: ubuntu-latest
    outputs:
      log_count: ${{ steps.query.outputs.log_count }}
      has_logs: ${{ steps.query.outputs.has_logs }}
    steps:
      - name: Checkout repository
        uses: actions/checkout@v4

      - name: Setup Node.js
        uses: actions/setup-node@v4
        with:
          node-version: ${{ env.NODE_VERSION }}


      - name: Install dependencies
        run: |
          npm install --global @salesforce/cli
          sf plugins:update
          sudo apt-get update && sudo apt-get install -y jq

      - name: 🔐 Authenticate to Salesforce Org
        run: |
          echo "${{ secrets.ORG_SFDX_URL }}" | sf org login sfdx-url --alias $ORG_ALIAS --set-default --sfdx-url-stdin
          sf org list

      - name: Query Debug Logs
        id: query
        timeout-minutes: 10
        run: |
          # Calculate start time (UTC)
          START_TIME=$(date -u -d "$DAYS_BACK days ago" '+%Y-%m-%dT%H:%M:%S.000Z')
          echo "🔍 Querying logs since: $START_TIME"

          # Create log directory
          mkdir -p "$LOG_DIR"

          # Query logs with proper SOQL syntax
          QUERY="SELECT Id, Application, DurationMilliseconds, LogLength, LogUserId, Operation, StartTime, Status \
                   FROM ApexLog \
                  WHERE StartTime >= $START_TIME \
                  ORDER BY StartTime DESC \
                  LIMIT 100"
          echo "Executing SOQL query..."
          sf data query \
            --query "$QUERY" \
            --target-org "$ORG_ALIAS" \
            --result-format json > logs_query.json

          # Extract log information
          log_count=$(jq -r '.result.totalSize' logs_query.json)

          if [ "$log_count" -eq 0 ]; then
            echo "⚠️ No logs found in the last $DAYS_BACK days"
            echo "log_count=0" >> $GITHUB_OUTPUT
            echo "has_logs=false" >> $GITHUB_OUTPUT
            echo "No logs found in the last $DAYS_BACK days" > "$LOG_DIR/no-logs-found.txt"
          else
            echo "📊 Found $log_count debug logs"
            echo "log_count=$log_count" >> $GITHUB_OUTPUT
            echo "has_logs=true" >> $GITHUB_OUTPUT

            # Save log metadata
            jq '.result.records[] | {Id, Application, DurationMilliseconds, LogLength, Operation, StartTime, Status}' \
              logs_query.json > "$LOG_DIR/log_metadata.json"
          fi

      - name: Download Log Contents
        if: steps.query.outputs.has_logs == 'true'
        timeout-minutes: 45
        run: |
          echo "📥 Downloading log contents..."

          # Extract log IDs
          log_ids=$(jq -r '.result.records[].Id' logs_query.json)
          total_logs=$(echo "$log_ids" | wc -l)
          current=0

          echo "Starting download of $total_logs logs..."

          # Download logs with progress tracking using `sf apex log get`
          downloaded_count=0
          for logid in $log_ids; do
            current=$((current + 1))
            echo "[$current/$total_logs] Attempting to download log: $logid"

            log_file="$LOG_DIR/$logid.log"
            tmp_error=$(mktemp)

            # Run and redirect stdout to log, stderr to temp error
            if sf apex log get --log-id "$logid" --target-org "$ORG_ALIAS" > "$log_file" 2> "$tmp_error"; then
              if [ -s "$log_file" ]; then
                echo "✅ Successfully downloaded $logid"
                downloaded_count=$((downloaded_count + 1))
              else
                echo "⚠️ Log $logid is empty (0 bytes)"
                echo "$logid (empty content)" >> "$LOG_DIR/failed_downloads.txt"
                rm -f "$log_file"  # Optional: delete empty log files
              fi
            else
              echo "❌ Failed to download log $logid"
              echo "$logid" >> "$LOG_DIR/failed_downloads.txt"
              if [ -s "$tmp_error" ]; then
                echo "🔍 Error details for $logid:"
                cat "$tmp_error"
                # Optional: Save the error only if non-empty
                cp "$tmp_error" "$LOG_DIR/errors_$logid.txt"
              else
                echo "⚠️ No error output for $logid"
              fi
            fi

            rm -f "$tmp_error"
            sleep 0.5
          done

          # Count successful downloads
          downloaded_count=$(find "$LOG_DIR" -name "*.log" | wc -l)
          echo "✅ Successfully downloaded $downloaded_count out of $total_logs logs"

      - name: Upload Log Artifacts
        uses: actions/upload-artifact@v4
        with:
          name: salesforce-debug-logs
          path: ${{ env.LOG_DIR }}
          retention-days: 7
          if-no-files-found: warn

      - name: 📄 Summary of Collected Logs
        run: |
          {
            echo "## 📊 Collect Logs Summary"
            echo "- Org Alias: **$ORG_ALIAS**"
            echo "- Days Back: **$DAYS_BACK**"
            echo "- Logs Found: **${{ steps.query.outputs.log_count }}**"
            if [ "${{ steps.query.outputs.has_logs }}" = "true" ]; then
              downloaded=$(find "$LOG_DIR" -name "*.log" | wc -l)
              echo "- Logs Downloaded: **$downloaded**"
              echo "- Artifact: \`salesforce-debug-logs\`"
            else
              echo "- No logs found in specified period"
            fi
          } >> $GITHUB_STEP_SUMMARY

  analyze-logs:
    name: Analyze Logs with Ollama
    runs-on: ubuntu-latest
    needs: collect-logs
    if: needs.collect-logs.outputs.has_logs == 'true'
    steps:
      - name: Download Log Artifacts
        uses: actions/download-artifact@v4
        with:
          name: salesforce-debug-logs
          path: logs

      - name: Install Ollama
        run: |
          echo "🚀 Installing Ollama..."
          curl -fsSL https://ollama.com/install.sh | sh
          ollama serve &
          for i in {1..30}; do
            if curl -s http://localhost:11434/api/version > /dev/null; then
              break
            fi
            sleep 2
          done

      - name: Download Model
        timeout-minutes: 30
        run: |
          MODEL="${{ inputs.MODEL_NAME }}"
          echo "Downloading Ollama model: $MODEL"
          ollama pull "$MODEL"

          echo "🔍 Verifying model installation..."
          ollama list


      - name: Analyze logs in batches
        run: |
          REPORT_FILE="analysis_report.md"
          BATCH_SIZE=5
          MODEL="${{ inputs.model_name }}"

          # Initialize report
          echo "# AI Log Analysis Report" > "$REPORT_FILE"
          echo "Model used: $MODEL" >> "$REPORT_FILE"
          echo "" >> "$REPORT_FILE"

          # Function to generate AI prompt
          generate_prompt() {
            local combined_logs="$1"
            cat <<EOF
            You are a Salesforce Debug Log analyzer.
            Read the following Apex debug logs (multiple) and produce a **short structured report** in markdown.

            **Rules:**
            - Use ONLY the information present in the logs. Do not speculate.
            - NO Java, pseudo-code, or unrelated language examples.
            - NO generic Salesforce explanations.
            - Output must be under 500 words.

            **Output Format (Markdown table):**
            | Category | Findings |
            |----------|----------|
            | Problems & Errors | Bullet points of exceptions, failed DML, missing data, etc. |
            | Latency Sources | Bullet points with operation names and durations in ms (if available) |
            | Governor Limit Usage | Bullet points showing limit name, used/total, and % |
            | Code Anti-Patterns | Bullet points identifying inefficient patterns like SOQL/DML in loops, inefficient queries, etc. |

            **Additional:**
              - Sort each section by severity/impact.
              - For governor limits, only list limits above 50% usage or breached.
              - For anti-patterns, flag:
                - SOQL queries inside 'for' loops
                - DML operations inside loops
                - Large collections without bulk handling
                - Use of deprecated methods
              - Indicate which log file each finding came from in parentheses.

            Logs:
            $combined_logs
          EOF
          }
          # Process logs in batches
          batch=()
          for file in logs/*.log; do
            batch+=("$file")

            # If batch is full, process it
            if [[ ${#batch[@]} -eq $BATCH_SIZE ]]; then
              combined=$(cat "${batch[@]}")
              echo "## Batch starting with ${batch[0]}" >> "$REPORT_FILE"

              prompt="$(generate_prompt "$combined")"
              ollama run "$MODEL" "$prompt" >> "$REPORT_FILE"
              echo -e "\n---\n" >> "$REPORT_FILE"

              # Reset batch
              batch=()
            fi
          done

          # Process final incomplete batch
          if [[ ${#batch[@]} -gt 0 ]]; then
            combined=$(cat "${batch[@]}")
            echo "## Final Batch starting with ${batch[0]}" >> "$REPORT_FILE"

            prompt="$(generate_prompt "$combined")"
            ollama run "$MODEL" "$prompt" >> "$REPORT_FILE"
            echo -e "\n---\n" >> "$REPORT_FILE"
          fi

      - name: Upload Analysis Report
        uses: actions/upload-artifact@v4
        with:
          name: salesforce-log-analysis
          path: analysis_report.md
          retention-days: 7

      - name: 📄 Summary of Analysis
        env:
          MODEL: ${{ inputs.model_name }}
        run: |
          {
            echo "## 🧠 Analysis Summary"
            total_logs=$(ls logs/*.log 2>/dev/null | wc -l || echo 0)
            echo "- Logs Analyzed: **$total_logs**"
            echo "- Model: \`$MODEL\`"
            echo "- Report File: \`analysis_report.md\` (saved as artifact \`salesforce-log-analysis\`)"
          } >> $GITHUB_STEP_SUMMARY
Executing and Monitoring the Pipeline
To run and track your workflow:
- Access GitHub Actions:
- Open your repository → click the Actions tab in the top navigation bar.
- Trigger the Workflow:
- In the left sidebar → locate the AI Powered Log Analyzer workflow.
- Click the Run Workflow Dropdown → Verify Inputs → Execute.
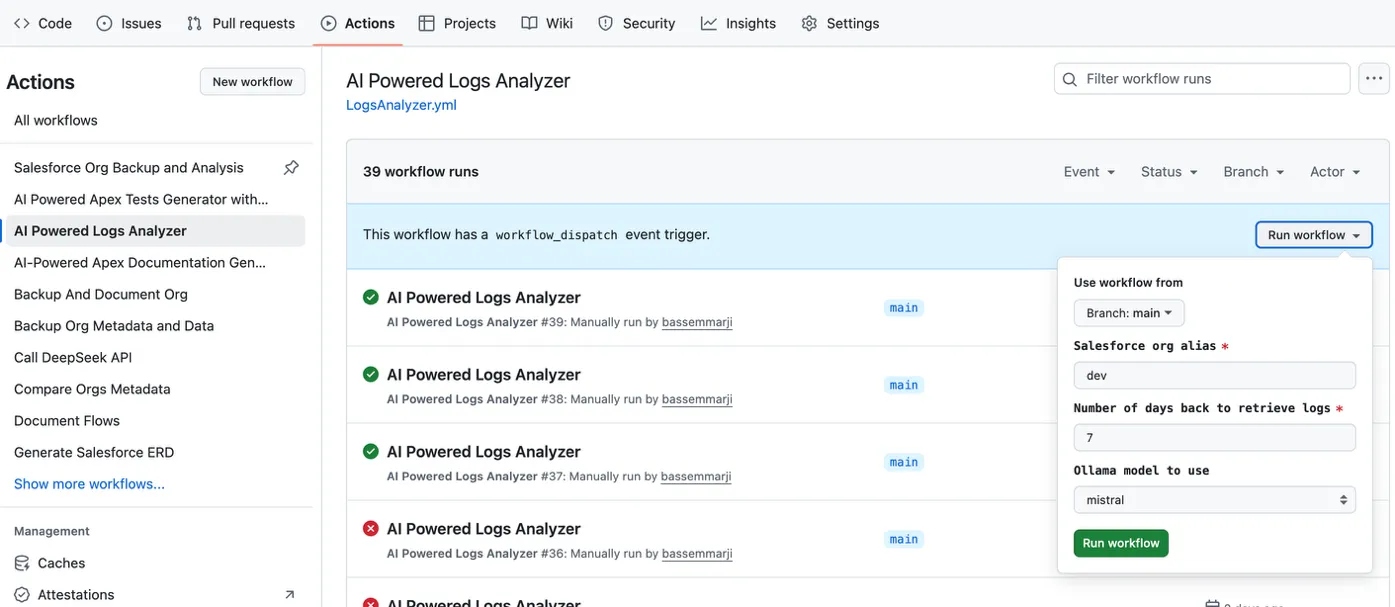
- Monitor Execution: Expand individual job instances to inspect logs and outputs
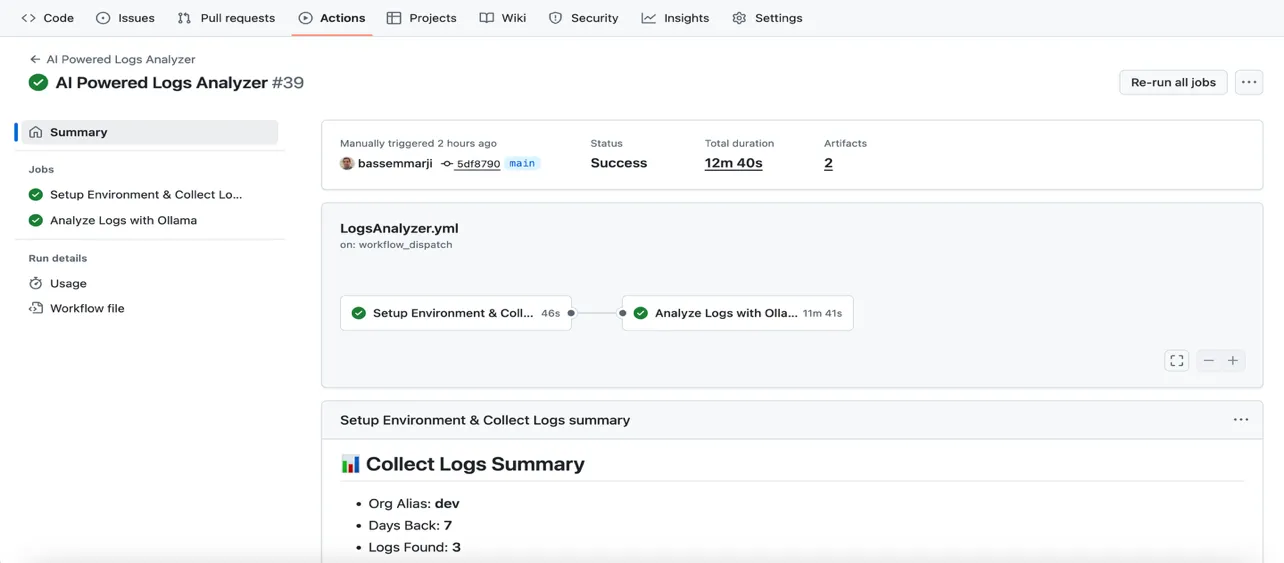
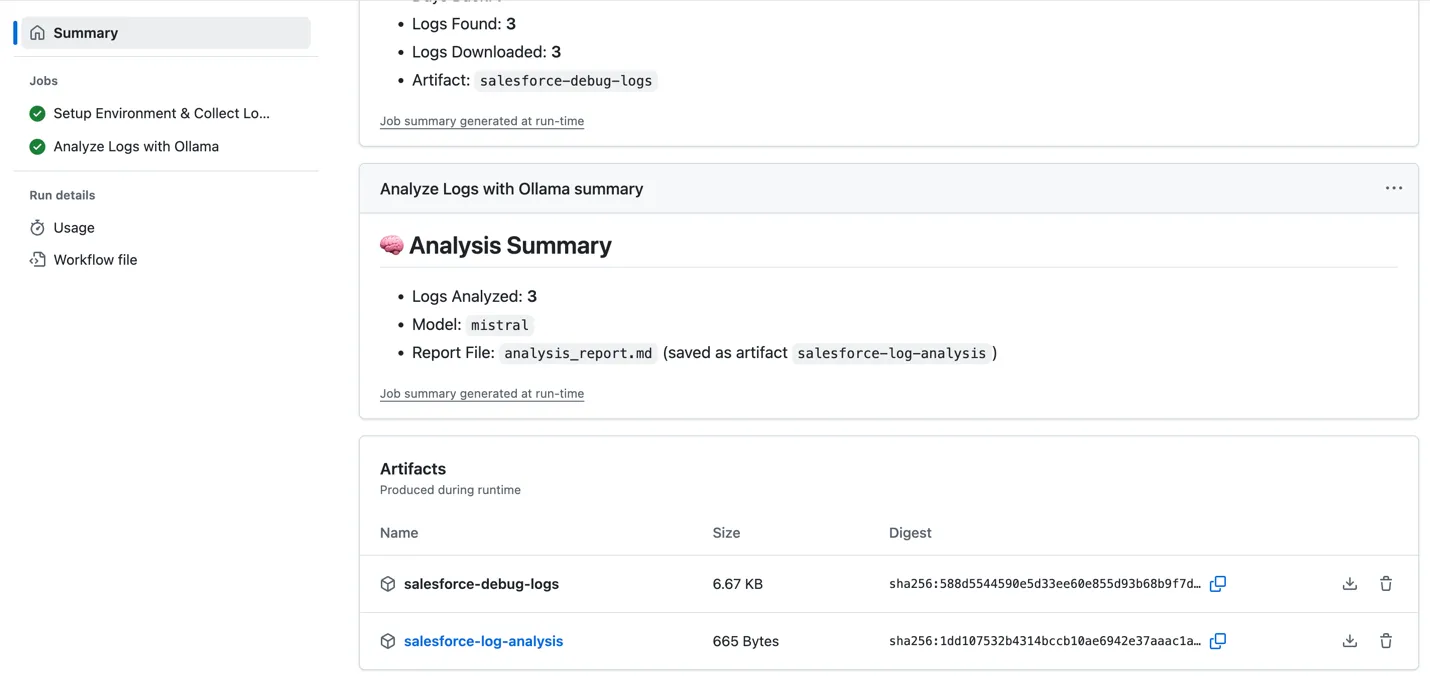
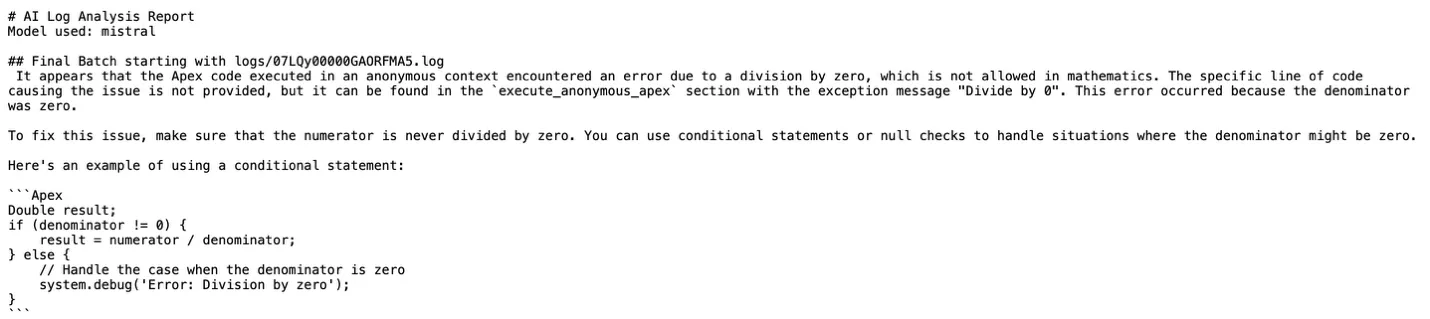
- Review Results: Download the
salesforce-log-analysisartifact and inspect the generated markdown report to uncover critical insights:
Business Impact
Organizations implementing this AI-powered debug log analysis pipeline will typically see significant improvements across multiple dimensions:
- Early detection of performance regressions during development cycles.
- Proactive identification of governor limit risks.
- Systematic discovery of code anti-patterns across the entire codebase.
- Consistent application of best practices through automated analysis.
- Reduced production incidents through proactive issue identification.
- Lower support overhead by catching issues in development environments.
- Optimized resource usage through performance bottleneck identification.
Final Thoughts
This AI-powered debug log analysis pipeline embodies a fundamental shift in how organizations approach Salesforce development and operations.
This pipeline democratizes expert-level debugging knowledge, making sophisticated analysis capabilities available to developers at all skill levels. Junior developers gain access to insights that previously required senior expertise, while senior developers can focus on architectural decisions and complex problem-solving rather than routine log analysis.
