

Salesforce API monitoring can feel like an afterthought – until something goes wrong. This article is a practical guide for admins who want to understand their org’s API usage, set up sensible alerts, and be ready to answer questions when traffic looks unusual. We will cover limits, native tools, governance practices, and the building blocks of deeper monitoring.
Let us start with a scenario that might sound familiar.
The Monday Morning Alert
It is Monday, 08:12. Your inbox says: “API usage reached 85% of your daily limit.” This was from Saturday. Nobody was supposed to be working.
You have an alert and a number, but not a story. Slack pings. “Saw the 85% alert. What happened?” – your CEO.
Here is the uncomfortable gap you sit in as an admin: there is a clear signal that something unusual happened, but it is hard to explain quickly who did it, with which app, and whether you should be worried.
Why Should API Monitoring Be on Your List?
Let us be honest: you already have more than enough to do. So why should API monitoring be on your list at all?
Because it helps you answer three questions that come up again and again:
Are Our Integrations Running Normally?
In a healthy org, API traffic is boring and predictable. Similar volume on similar days. The same integration users and apps are doing most of the work. No sudden spikes that nobody can explain.
Are We Ready for Salesforce Changes?
When Salesforce retires API versions (like 21 to 30), anything still talking to your org on those versions will break. If you cannot see who is using which API family and version, you are effectively waiting to find out the hard way.
Could We Help Security If Something Looked Suspicious?
If someone reports unusual activity, you want to be able to say which users and apps accessed Salesforce at that time, roughly from where, and at what scale. You may not run the investigation yourself, but you should not be empty-handed.
Good API monitoring gives you enough information to answer these questions without guessing or opening a case every time.
Understanding Salesforce API Limits
Salesforce is a multi-tenant platform. Your org shares infrastructure with many other customers. API limits exist to keep that shared environment fair and stable.
For admins, the most important thing is to understand how the limits behave over time, especially the difference between the soft limit and the protection “cliff.”
Daily API Request Limit
Every org has a Daily API Request Limit. At a high level:
- It counts calls to the REST API, SOAP API, Bulk APIs, and the Connect API.
- It is measured over a rolling 24-hour window, not from midnight to midnight.
- It scales with your edition and with some license counts.
This is a soft limit. Soft limit means:
- Salesforce can allow your org to go over the Daily API Request Limit for a short time if the platform is still healthy.
- Those extra calls are still tracked and counted.
- If usage keeps rising, a protection threshold is reached where the platform starts blocking new API calls.
When that protection limit is hit:
- Calls fail with HTTP status code 403 and error code
REQUEST_LIMIT_EXCEEDED. - Calls stay blocked until your usage over the last 24 hours drops back into the safe range.
You do not need to know the exact internal threshold. What matters is the behavior: short bursts over the documented limit may be allowed, but if they continue, you fall off a cliff where everything starts failing.
That cliff is why the documented Daily API Request Limit matters as a guardrail – not because Salesforce enforces it rigidly, but because staying comfortably below it gives you room to absorb unexpected spikes. If you find yourself crossing the limit regularly, treat it as a signal to investigate, not as a new normal to accept.
Monthly API Entitlement
The Monthly API Entitlement is a 30-day view of your API usage and capacity.
Conceptually, it is your Daily API Request Limit aggregated across a month. Salesforce tracks how many API calls your org has made in the last 30 days and compares that number to your entitlement.
Here are some other key points to consider:
- There is no hard block tied to the Monthly Entitlement.
- It is a trend indicator that smooths out noisy individual days.
- It helps you see whether API usage is growing steadily over time.
You can use the Monthly Entitlement to separate one-off spikes from gradual growth and to have concrete numbers when talking to project teams about expected API load from new initiatives.
Where Can You See Limits and Current Usage?
You do not need any special tools to see these numbers. Two standard Setup pages already give you the key information.
Company Information
Path: Setup → Company Information.
Look for:
- API Requests, Last 24 Hours in the Organization Detail section – This shows how many API calls your org has made in the last rolling 24 hours, with the Daily API Request Limit in brackets.
- API Request Limit per Month in the Usage-Based Entitlements section – This shows your Monthly API Entitlement and how many API calls you have made in the last 30 days.
These two fields answer “How close are we to the limit right now?” and “Is our 30-day usage growing or stable?”
System Overview
Path: Setup → System Overview.
Here you will see a tile for API Requests, Last 24 Hours that shows:
- The number of API calls in the last 24 hours.
- A bar that shows that value as a percentage of your Daily API Request Limit.
System Overview is a quick health panel you can glance at:
- Right after deployments.
- During big data loads.
- On Monday morning, after a busy weekend.
It does not replace detailed analysis, but it tells you whether you are roughly in a safe range.
For Developers and Technical Admins
If you work closely with developers, there are two extra places where limit information appears:
- The
Sforce-Limit-Infoheader in REST and SOAP responses. - The
/services/data/vXX.0/limitsREST resource, which is also surfaced through thesf org list limitsCLI command.
Developers can use these to bring limit information into their own dashboards or health checks so that monitoring API usage becomes a shared responsibility.
Native Monitoring Every Admin Should Enable
Once you understand the limits, the next step is to use the standard tools Salesforce already gives you to watch your usage.
You do not need any extra products for this section. Everything here is available in a typical Enterprise org.
The “API Usage in the Last 7 Days” Report
The Classic report “API Usage in the Last 7 Days” is often overlooked by admins, but it is useful for understanding who is driving API usage.
You can find it in Salesforce Classic under: Reports → Administrative Reports → API Usage in the Last 7 Days.
Practical details:
- It is available in Enterprise, Performance, and Unlimited Editions.
- It may require additional activation in Professional Edition.
- To see it, you need View Setup and Configuration.
- For non-admin users to see it, they need Modify All Data.
What it shows:
- A row per user per day.
- For the last seven days, including today.
- With the number of API calls made.
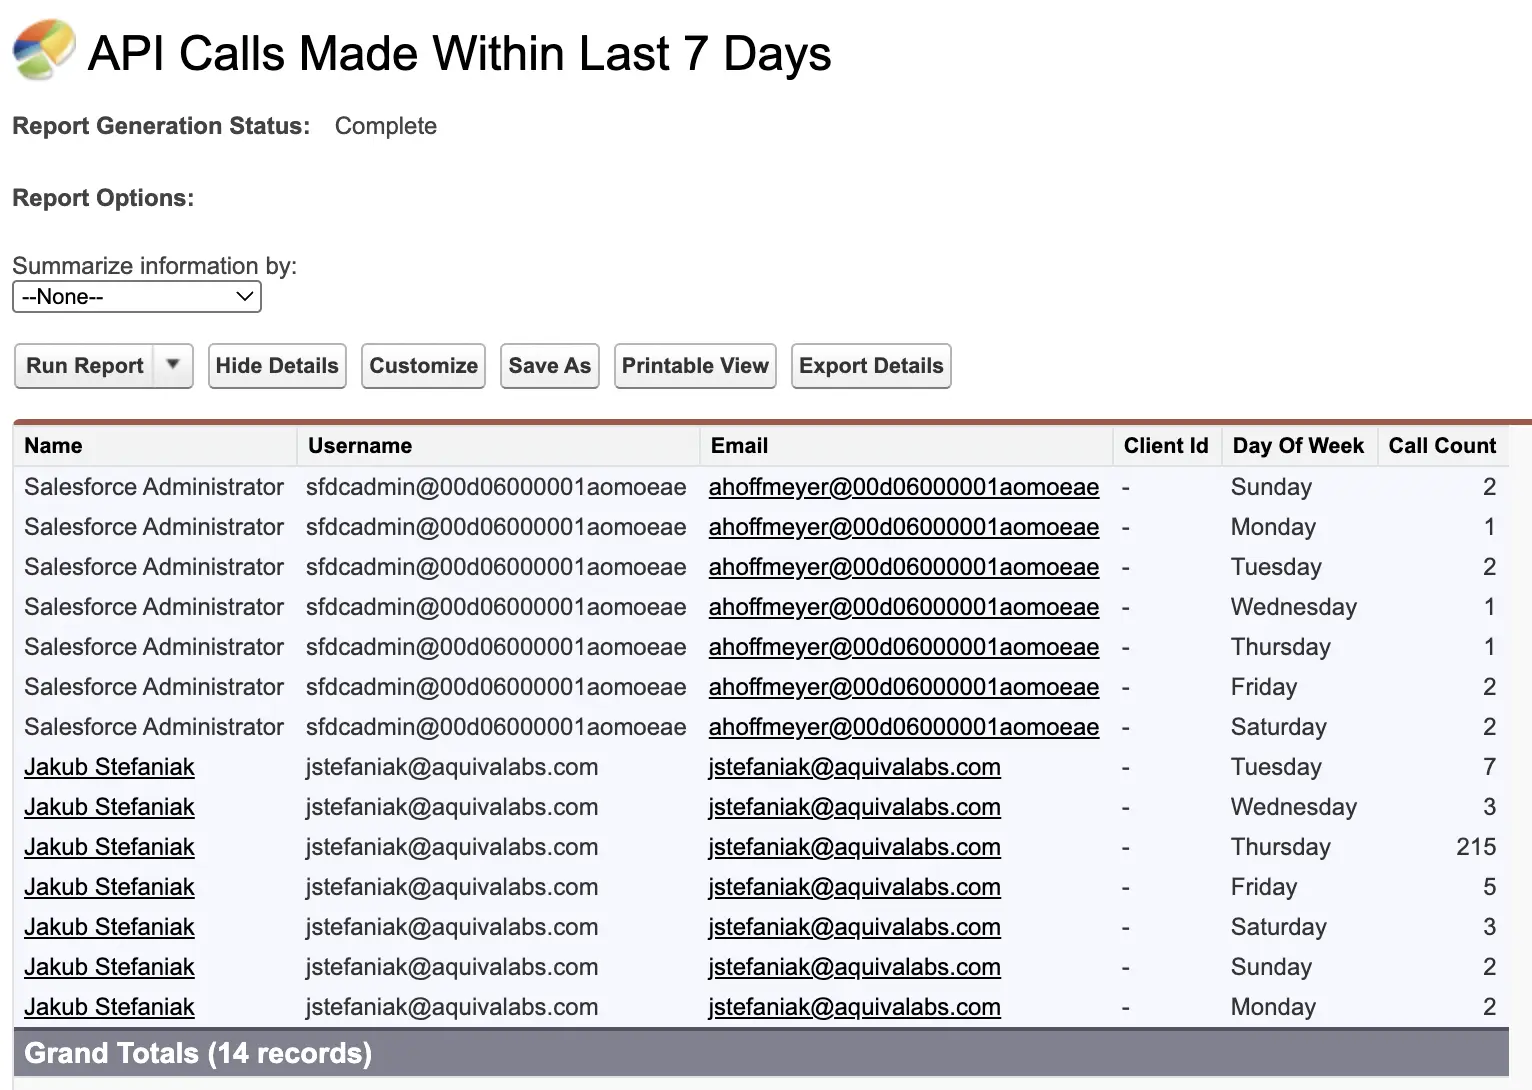
Limitations to keep in mind:
- It is a daily rollup, so you do not see the exact time of requests.
- Some API activity, for example, certain Bulk API operations, may not appear here.
How to make it more useful:
- Clone the report so you can customize it.
- Group by User and then by Date to see who is consistently at the top.
- Add a chart to visualize calls per day.
- Save it to a shared folder for your admin or operations team.
The goal is not perfect accuracy but a quick way to answer, “Which users or integrations are responsible for most of our recent calls?”
API Usage Notifications
API Usage Notifications are one of the simplest things you can turn on to avoid surprises.
You can configure them in Setup → API Usage Notifications.

Each notification defines:
- A threshold in percent of your Daily API Request Limit.
- A time window (per hour, per four hours, per day).
When your org crosses that threshold in that window, Salesforce sends an email to the recipients you choose.
A sensible starting configuration for many orgs:
- 50 percent in the last 24 hours, checked once per day.
- 80 percent in the last four hours, checked every four hours.
- 90 percent in the last hour, checked every hour.
You can adjust those numbers once you know your normal patterns.
Make sure notifications go to:
- At least one active admin mailbox.
- Ideally, a shared address used for operations or on-call work.
Notifications are not a complete monitoring solution, but they give you an early warning that you are using more API calls than usual.
Event Log Browser and Free API Total Usage Logs
System Overview and the seven-day report show you totals. If you want to see the individual API requests that make up those numbers, you need to look at event logs.
The Event Log Browser is available in all orgs for some event types, including API Total Usage.
To enable it: Setup → Security → Event Monitoring → Event Monitoring Settings → Enable “Generate event log files”.

To access it: Setup → Security → Event Monitoring → Event Log Browser.
From there, you can:
- Filter to the API Total Usage event type.
- Download CSV files for the last 24 hours.
These files show a row per API event. Important fields include:
| Field | Description |
|---|---|
| USER_ID | The Salesforce user the call ran as (often an integration user) |
| CLIENT_IP | The IP address of the client sending the request |
| CONNECTED_APP_ID | The connected app or external client identifier |
| CLIENT_NAME | An optional name set by the client to identify itself |
| API_FAMILY / API_RESOURCE | Which API and which endpoint were used |
| ENTITY_NAME | The object that was accessed (e.g., Account, Contact) |
| ROWS_PROCESSED | Roughly how many records were involved |
| STATUS_CODE | The HTTP response code (200, 401, 500, etc.) |
| REQUEST_ID | A unique identifier to match this event with others |
For now, the most important takeaway is that API Total Usage is your detailed source of truth. System Overview, reports, and notifications are helpful summaries, but when you really need to know what happened, you will usually end up looking at these event logs.
In later sections, we will come back to these fields when we talk about CONNECTED_APP_ID and baselines.
API Governance Best Practices
Some basic patterns make a big difference to how easy or hard it is to understand your API usage.
You do not have to implement all of these overnight, but moving in this direction will make both monitoring and security work easier.
One App, One Identity
Where possible, give each integration its own identity. In practice, that means:
- Use a separate connected app or external client app for each major integration.
- Avoid many unrelated tools all sharing the same generic connection.
When each app has its own identity, you can:
- See its activity in API Total Usage via
CONNECTED_APP_ID. - Turn it off or restrict it without affecting other tools.
- Reason about its behavior separately from other integrations.
Always Set a Clear Client Name
Salesforce logs an optional CLIENT_NAME field for API events. Many clients ignore it or leave it with a default like “python-requests.”
Encourage your vendors and internal developers to:
- Set
CLIENT_NAMEusing theSforce-Call-Optionsheader. - Use a clear, human-readable label, for example, “DataWarehouse ETL Prod”.
This does not change security by itself, but it makes logs much easier to read. When you open an API Total Usage file, you can see at a glance which application was likely responsible for each call.
Dedicated Integration Users
Salesforce recommends using dedicated users for integrations.
As an admin, this gives you:
- Cleaner audit trails: you can see which integration did what.
- Tighter permissions: each integration user only needs access to the objects and fields required for that integration.
- Easier troubleshooting: you can disable or adjust one integration user without affecting others.
Where possible:
- Avoid reusing a single generic “integration” user for many unrelated tools.
- Give each significant integration its own user with its own profile or permission sets.
Maintain a Simple Integration Catalog
A small spreadsheet or internal page can save you hours when something unusual happens. For each integration, record:
- Name of the application.
- Business owner and technical owner.
- Connected app or external app identifier.
- Integration user.
- Expected pattern of usage (e.g., “runs at 03:00 daily”).
- Typical volume of API calls per day.
- Current API family and version (e.g., “REST v60” or “Bulk 2.0”).
You do not need this to be perfect. Even a rough catalog is better than having to rediscover the basics every time there is a spike.
How Does This Help During Real Advisories?
When Salesforce or a vendor publishes a security advisory involving API activity, the first step is usually to check whether your org has been affected.
If you have:
- Dedicated integration users.
- Separate connected apps per integration.
- Clear client names.
- An up-to-date integration catalog.
Then answering that question is much easier. You can quickly:
- See which integrations match the advisory.
- Filter API Total Usage logs by the relevant users or apps.
- Decide whether you need to rotate credentials, revoke tokens, or take other action.
These governance practices are not about adding bureaucracy. They are about making sure that, when something happens, you are not starting from zero.
The CONNECTED_APP_ID Puzzle
By this point, you have seen the CONNECTED_APP_ID field mentioned a few times. For serious API monitoring, this field matters a lot. It is the link between a raw API event and the application that sent it.
How Is CONNECTED_APP_ID Encoded?
In the API Total Usage event logs, CONNECTED_APP_ID is a text identifier. The value tells you what kind of client made the request.
In practice, you will mostly see two patterns:
- Values that start with 0H4
- Values that start with 888
Salesforce uses these prefixes as hints where:
- 0H4 means the ID refers to a connected app in your org.
- 888 means the ID refers to an external client app that Salesforce knows about, but that does not show up in your own Connected Apps list.
Working With 0H4 IDs
For IDs that start with 0H4, you can usually resolve them yourself.
A common pattern is:
- Take your My Domain, for example:
https://mydomain.my.salesforce.com - Append the 0H4 ID, for example:
https://mydomain.my.salesforce.com/0H4XXXXXXXXXXXX - Open that URL in your browser.
This should take you to the Connected App record in Setup, where you can see the app name, publisher, policies, and which users or profiles can use it.
This is very helpful when you are looking at API Total Usage rows and want to know whether a request came from a known Salesforce connected app, an AppExchange package, or a custom integration.
Working With 888 IDs
IDs that start with 888 are different. They refer to external client apps that do not live as connected apps inside your org. Salesforce maintains the mapping between these 888 IDs and the real client app names.
The official guidance is: if you want to know what a particular 888 ID represents, you need to open a case with Salesforce Support and ask them to look it up.
In other words, the process looks like this:
- You see an unfamiliar 888 ID in API Total Usage.
- You capture that ID and open a support case.
- Support confirms which client app that ID corresponds to.
- You write the answer down somewhere for future reference.
Why Is This Painful in Real Investigations?
From an admin perspective, 888 IDs create two practical problems.
First, they slow you down in the moment. If you are trying to understand a spike or investigate unusual activity, waiting for a support case reply is frustrating.
Second, you have to maintain your own mapping:
- There is no central place in Setup that shows “888 ID to app name” mappings.
- Different admins may keep their own notes or spreadsheets.
- Each time a new 888 ID appears, you repeat the same manual process.
The result is that many orgs simply treat 888 as an “unknown external app” and stop there, even though this is exactly the point where you would like clear information.
What Does “Good” Look Like for CONNECTED_APP_ID?
In a perfect world, when you open an API monitoring view, you would see:
- A clear, human-readable app name for every 0H4 and 888 ID.
- Ideally with some extra context, for example, “Marketing Automation Prod” or “Custom Integration X”.
You would not need to remember which IDs belong to which tools. You would not need to teach every new admin how to interpret 0H4 versus 888. The mapping would live in one place, and every report would use it.
This is one of the reasons CONNECTED_APP_ID matters so much for API monitoring. Api monitoring tools can help you work with these IDs more efficiently, but even a shared spreadsheet is better than nothing. The goal is the same either way: spending less time decoding event logs lets you act fast when it counts.
From Limits to Actual Monitoring: Baselines and Anomalies
Up to now, we have focused on limits, totals, and governance. Those are necessary foundations, but they are not the full story.
There is a deeper level of monitoring that looks not only at how many calls you have, but also at how they behave over time. This is where the idea of baselines and anomalies comes in.
Why Are Limit-Based Alerts Not Enough?
Consider this simple example. You have an integration that:
- Runs a batch job every night at 03:00.
- Makes about 30,000 API calls as part of that job.
This is completely normal and has been happening for months. Your limits are sized for it. You do not want alerts about it. It is just how your org works.
Now imagine that, without warning, the same integration starts making 30,000 calls at 19:00 instead.
From a limit perspective, nothing dramatic changed:
- Total calls per day are roughly the same.
- You are still comfortably under your Daily API Request Limit.
- Your Monthly Entitlement chart looks fine.
From an operational and security perspective, something is different:
- A job moved to a different time.
- It now runs in the middle of business hours.
- It runs at a time when you usually have no traffic from that tool.
The standard notifications and reports will not tell you this because they are not designed to.
Event Logs as Your Real Source of Truth
The only place you can see this kind of change clearly is in the event logs.
API Total Usage and related event types (if you have them) contain:
- Timestamps
- Users
CONNECTED_APP_IDvalues- IP addresses
- Objects and API endpoints
Everything else in this article sits on top of that data. System Overview shows totals. The seven-day report shows daily counts per user. Notifications fire when totals cross a threshold.
If you want to know whether behavior has changed for a specific app or user, you are always coming back to event-level data.
What Is a Baseline Really?
When people talk about “baselines” in monitoring, they usually mean, “What does normal look like for this thing over time?”
Applied to Salesforce API usage, useful baselines are not just “X calls per day.” They are patterns such as:
- For each connected app: Typical calls per day and per hour, and which objects and APIs it usually touches.
- For each integration user: Which hours and days of the week they are active, and in which ranges.
- For your org as a whole: Expected weekend behavior versus weekdays, and expected busy seasons.
Once you understand these patterns, you can say things like:
- “This much traffic is normal for our ETL tool at night, but strange at 19:00 on a weekday.”
- “This integration has never used Bulk API before, now it suddenly does.”
- “This user has never called the API from this country before.”
These are the kinds of observations that are very hard to get from a single percentage bar on System Overview.
Why Do Many Orgs Stop at Limits and Totals?
In theory, you can build these baselines yourself using:
- Regular exports of API Total Usage CSV files.
- A spreadsheet or BI tool.
- Your own charts and pivot tables.
In practice, most admin teams are too busy to keep this up manually, because it requires:
- Pulling data regularly.
- Keeping history somewhere.
- Normalizing the data by app and user.
- Reviewing charts often enough to spot slow drift.
The result is that many orgs do the basics (System Overview, seven-day report, notifications), but do not have a structured view of baseline behavior.
In the second part of this series, we will go deeper into real examples of drift and silent anomalies that never show up as limit problems, and how to detect them. The important point here is simply that this deeper level of monitoring exists, and that it starts with good event data.
When Do Native Tools Start to Hurt?
Standard Salesforce features can take you a long way. You should absolutely use System Overview, Company Information, the seven-day report, API Usage Notifications, and API Total Usage logs.
At some point, you may feel that you are spending more time stitching these pieces together than actually understanding what is going on.
Limits of the Native Approach
The main pain points admins tell us about are:
- Fragmented views: Limits are on Company Information and System Overview. Daily usage per user is in a Classic report. Detailed events are in CSV files from Event Log Browser.
- Short event history: Without Shield or an external pipeline, you only have a small window of API Total Usage logs available to download.
- Manual work to see patterns: Turning those CSVs into baselines and anomaly views usually means spreadsheets, ad hoc scripts, or a BI tool that someone has to maintain.
- Opaque client identities: CONNECTED_APP_ID and 888 IDs are not user-friendly by default. Mapping them to real app names is manual work.
Native tools are very good at answering “How many calls have we made?” and are less good at answering “What changed?” and “Which app is behaving differently from normal?”
What Does an API Monitoring Solution Add on Top?
sAPIm (Simple API Monitor for Salesforce) is a free managed package available on the AppExchange. It sits on top of the same API Total Usage event log files you already have.
The main things it adds on top of the native experience are:
- History beyond the short native window: so you can actually see trends and baselines
- Decoded identities: so you see friendly app names instead of only raw
CONNECTED_APP_IDvalues - Anomaly detection with notifications: so issues find you rather than requiring you to check another dashboard
In practical terms, it aims to:
- Alert you when something looks unusual – via Slack, email, or in-app notifications – so you can focus on other work on calm days.
- Let you pivot easily by connected app, user, IP address, day, and hour when you do need to investigate.
- Keep history so that baselines and trends are visible.
- Help you resolve and reuse mappings for
CONNECTED_APP_ID, so you see app names, not just IDs.
Instead of six separate places in Setup and a folder full of CSV files, you get one place to explore the story behind an alert or a spike – and notifications that bring important changes to your attention automatically.
Tools like sAPIm exist precisely because these pain points are so common. Whatever path you choose, the important thing is to stop treating API usage as an opaque number that only surfaces in error emails.
When you can see patterns, explain spikes, and catch anomalies before they become incidents, you move from reactive firefighting to proactive awareness – and that is what good API monitoring looks like.
Disclosure: I’m affiliated with sAPIm, and the package is free. I’m mentioning it as a concrete reference implementation of the “install instead of build” approach described above, not as a blanket recommendation. The real decision is still whether you want to operate the pipeline yourself. Building gives maximum control and customization, while installing a package reduces infrastructure and maintenance work. Choose based on your team’s capacity to own ingestion, storage/retention, detector tuning, and alerting over time.
The Ultimate API Monitoring Checklist
If you want to turn this article into action, here is a simple downloadable checklist you can follow.
Final Thoughts
Monitoring Salesforce API usage is not just about avoiding an error message. It is about understanding how your org really talks to and through Salesforce. As an admin, you do not need Shield or a full security team to make progress. With the features you already have, you can:
- See your limits and how close you are to them.
- Set up simple alerts so you are not surprised by spikes.
- Use standard reports to see which users and integrations do most of the work.
- Use API Total Usage logs to answer detailed questions when something unusual happens.
Good governance practices – one app per identity, clear client names, dedicated integration users – make those tools much more effective. They also make it much easier to respond when Salesforce or a vendor publishes a security advisory.
If you want to go further, you can use event logs to build baselines and look for anomalies. And you can, of course, look for free or paid tools to help you with that work. In Part 2 of this series, we will explore the types of anomalies that hide in plain sight, the algorithms that detect them, and how to build or install a system that turns raw API events into actionable alerts.
The important thing is that you do not stay at the level of a single percentage bar in System Overview. When your next “85 percent” email arrives, you should be able to say more than “we hit a threshold.” You should be able to tell a simple story: which integration, which user, roughly when, and whether this fits your org’s normal pattern.
That is what it means to monitor your Salesforce API usage like a pro.
Resources
- API Limits and Allocations
- Monitoring Your API Usage (Developer Blog)
- API Total Usage Event Type
- Event Log Browser
- sAPIm – Simple API Monitor for Salesforce