


From working as a consultant to being an end-user, reports have often been the main topic for all levels of management in the businesses I have worked in. One of the main factors why companies use Salesforce is the ability to get the most understanding of how teams are performing, using the least number of clicks.
Salesforce Lightning has opened doors for analysts, administrators, and users to tell a better story with data. If you are new to Salesforce, or your organization has recently made the switch to Lightning, here are 5 tips you can use to get more out of Lightning Reports and Dashboards.
1. Interactive Filters
Do you have different teams segregated by country, region, or industry? Lightning Reports enable users to select filters that matter to them. Whether it is viewing reports by a time period, sales teams, or other fields to enable teams to understand performance and trends.
For instance, you are building a Global Dashboard which all levels of managers in different roles can access. A Director that is managing teams from different countries can simply make use of dashboard filters to switch views between country teams to visually compare how they are doing. What is great, in addition, is that data sharing in the role hierarchy is respected – for example, a Country Manager with role hierarchy access bound to data for the country they are responsible for will only be viewing only data related to their team.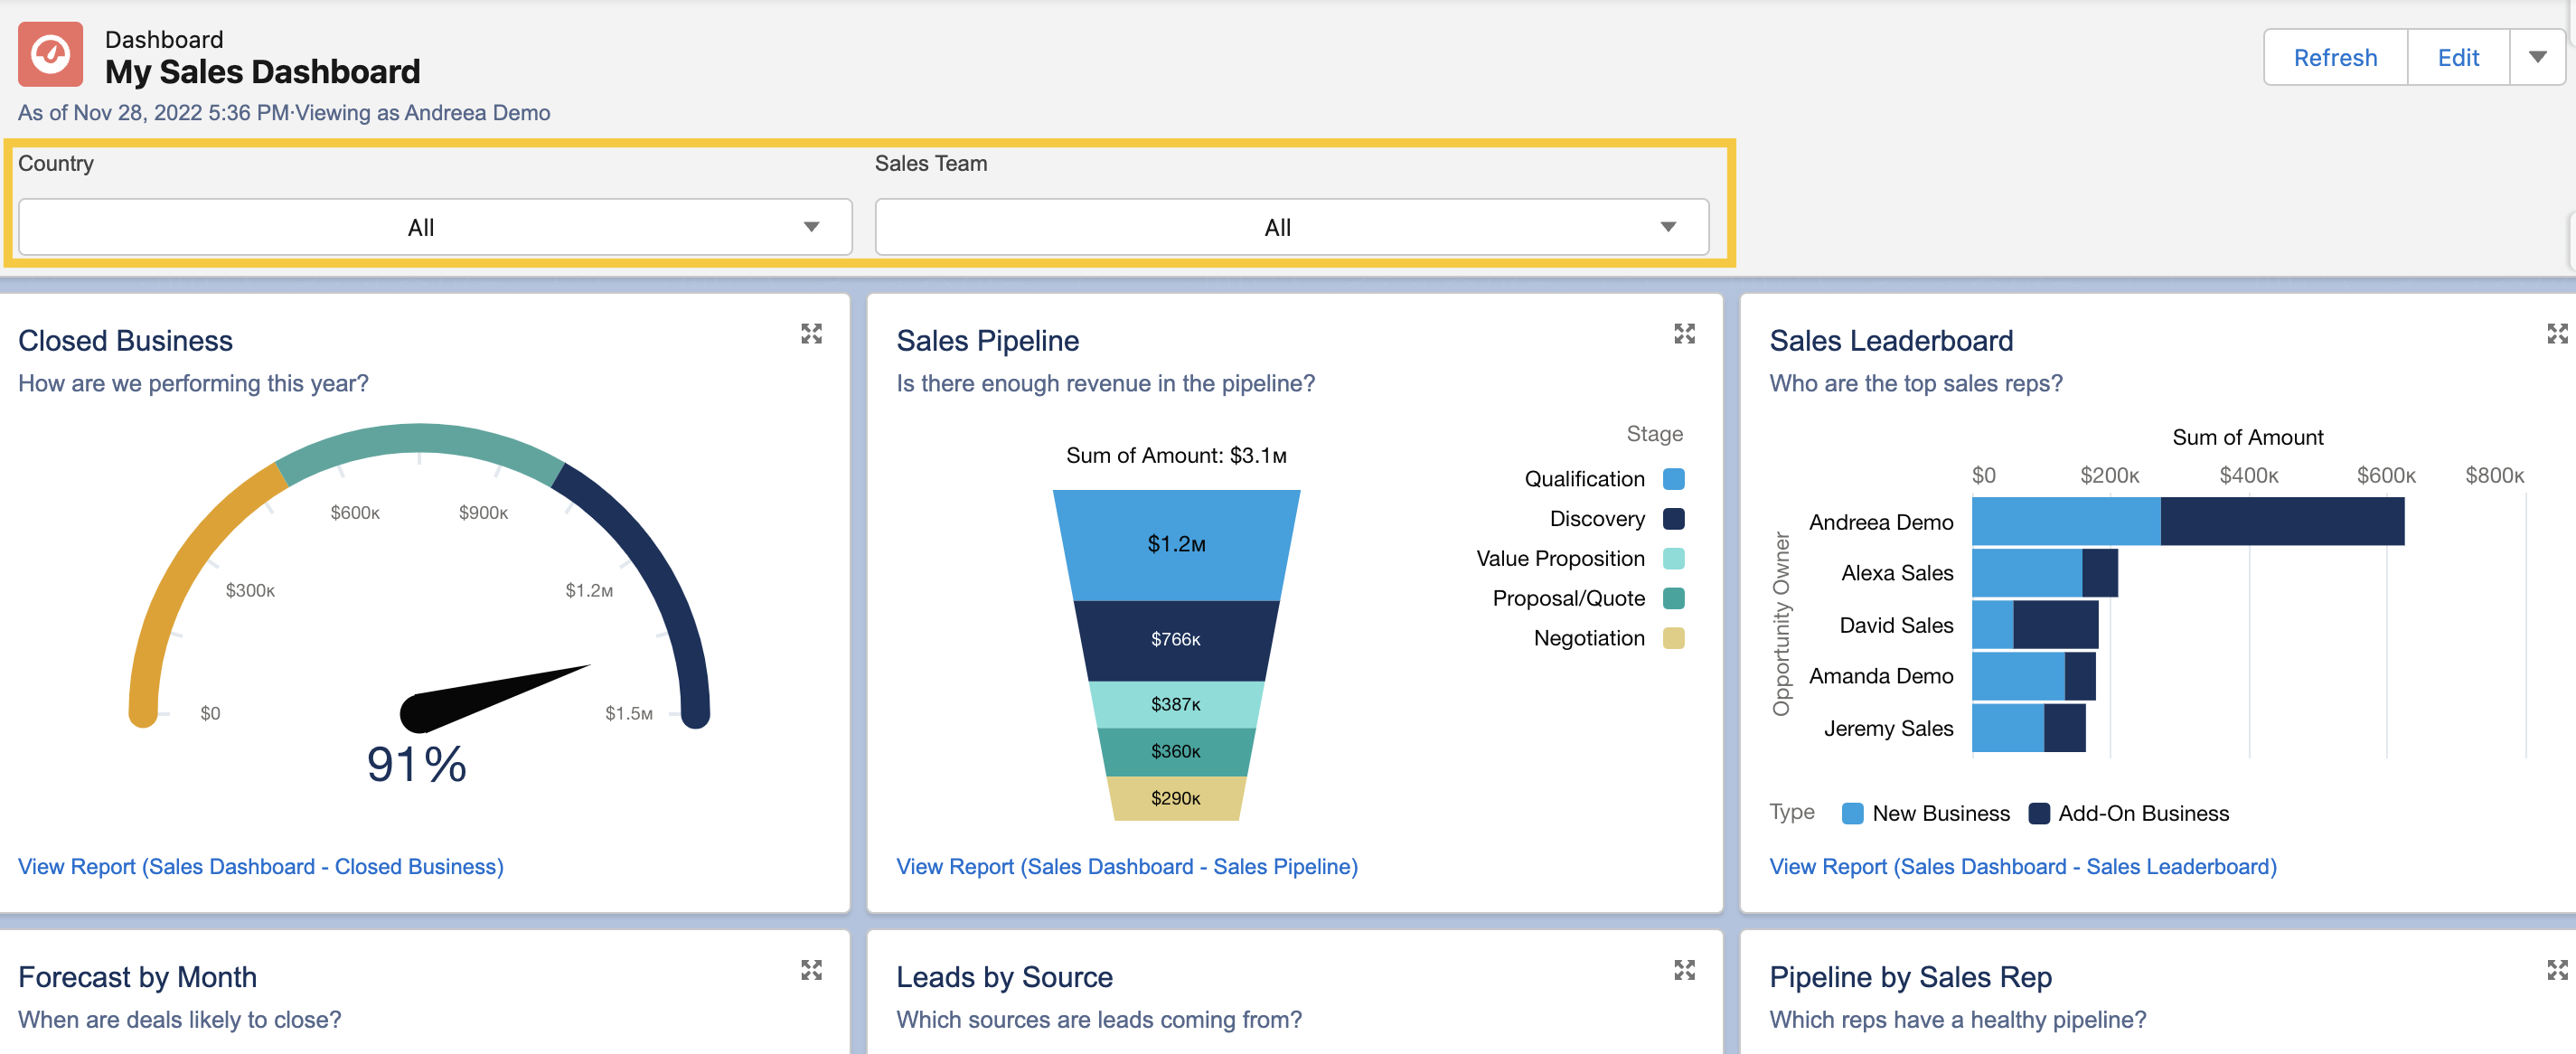
To start building filters in Dashboards:
- Click on + Filter and search for the field that you wish to filter by.
- Input the Display Name you wish to set for your filter, using Filter Values to filter values by.
- Input the Display Text if you need to show a text different from the value in Salesforce

2. Stacked Summaries
With the enhanced Lightning Report Builder, Stacked Summaries are enabled by default. Users can easily summarise a substantial amount of data for quicker review and comparison.
For example, if you need to show the number of opportunities that are in each Stage, as well as the sub-total of Qualification opportunities by each of the Opportunity Owners, that’s possible with Stacked Summaries activated at the bottom of your report page. You can view record count by each country, each opportunity owner, or other sub-total counts that your report is grouped by.
3. Build Reports Using Columns and Rows
Users can now select which rows and columns to display, with the option to swap rows and columns to view what works best.

Take for instance you are building a report with opportunity owner as your rows, and opportunity revenue as your columns. While building the report, you realized the list of opportunity owners will be more suitable to display as columns to enable printing with the rest of your files into an annual report. You can simply hit the “Swap Rows and Columns” to save time, instead of dragging fields one at a time to make this change!
4. Filter On-the-Fly with Dynamic Reports
Users do not need to edit the entire report if they need to view it with a different filter applied. With the Lightning Report Filter function, users can easily adjust filters after the report is run as they wish, while keeping the saved report filters intact.

Let’s say you have provided access to a report across the top management of your organization. Different stakeholders within the management team wish to toggle different views of the report themselves, to meet their interests. Rather than saving multiple versions of the same report, you can simply create a filter and leave the filter value blank. This way, users than creating a Dynamic Report which viewers can enter filters and run reports quickly – it prevents other users from edits to the main structure of the report. A win-win for everyone!

5. Light vs. Dark Mode for Lightning Dashboards
To differentiate components in a Lightning Dashboard, users can switch between light or dark mode per component, or even a different colour palette so that report viewers will be drawn to the most important data.
To color your dashboards we have to add a permission to our user profile:
- Navigate to Setup > Permissions Sets.
- Create a new permission set called Dashboard Coloring or similar.
- You will be able to find the specific permission under “System Permissions” and its called “Change Dashboard Colors”.
- Once done, save the permission set and then add it to whichever user records necessary.
- When this is added, navigate over to a Lightning Dashboard and click the little cog to jump into the settings.
Here, you can select different color palettes, including a dark or light theme. You can even control the light or dark setting per component, giving you that extra level of flexibility.

This is especially useful if you have been building multiple dashboards for the sales team by time period, region, industry. In order to show a more eye-catching view for dashboard showing actual revenue vs target revenue, you can select properties at the top right page of the dashboard, scroll to the bottom to choose a different dashboard theme or palette.
Summary
This post has covered 5 tips you can use to get more out of Lightning Reports and Dashboards. You will be well on your way to becoming a more Salesforce-savvy user, and getting the information you need in the most effective way and tell a better story with data.


Comments: