


During the Summer ‘25 release, Salesforce gave us a much-awaited surprise, in the form of an overhauled experience for the good old debug mode in Salesforce Flows. While this new experience was available for Record-Triggered and Autolaunched Flows from the get-go, Screen Flows still triggered the old experience – that is, until Winter ‘26!
In this article, we’ll deep dive into how Screen Flows can be debugged, but also how the new Debug Panel makes the experience so much more efficient.
Do You Screen Flow?
Creating Screen Flows can be seen as the most imperative skill Salesforce Admins can develop when it comes to tailoring the user experience. This type of Flow has been, from day one, the main differentiator between visual workflow (the first iteration of what we know today as Salesforce Flow), Process Builder and Workflow Rules – the two legacy automation tools could handle background automations, but never something of a custom wizard to guide the user through the process, leveraging a mix of user input and calculations.
If you haven’t created your first Screen Flow yet, you should do that as a first step. Discovering the power that Screen Flows and related components yield will add a whole new dimension to how you satisfy certain user requirements. If you’re already well into your Salesforce Flow journey – including the amazing screen reactivity capabilities – then what can be more reassuring than ensuring your wizard works as intended, and it’s ready to be deployed to production?
3, 2, 1… Debug!
Ideally, no screen flow should be activated before testing and debugging is done, to ensure that everything works as expected, records are successfully created if any, and so on. Since this type of flow requires user interaction, if part of the process goes south, the impact on the user experience will likely be immediate, especially if an unexpected error comes up, for example.
Debugging within Flow Builder actually translates into clicking a button called “Debug” which, in this case, will give you the possibility to go through the wizard screen by screen, and test every single aspect of it – be it input, formulas, or even Action Buttons if you used any. Salesforce recently made major changes to the debugging experience, and with Winter ‘26, the Screen Flow debugging experience finally got the long-awaited makeover as well.
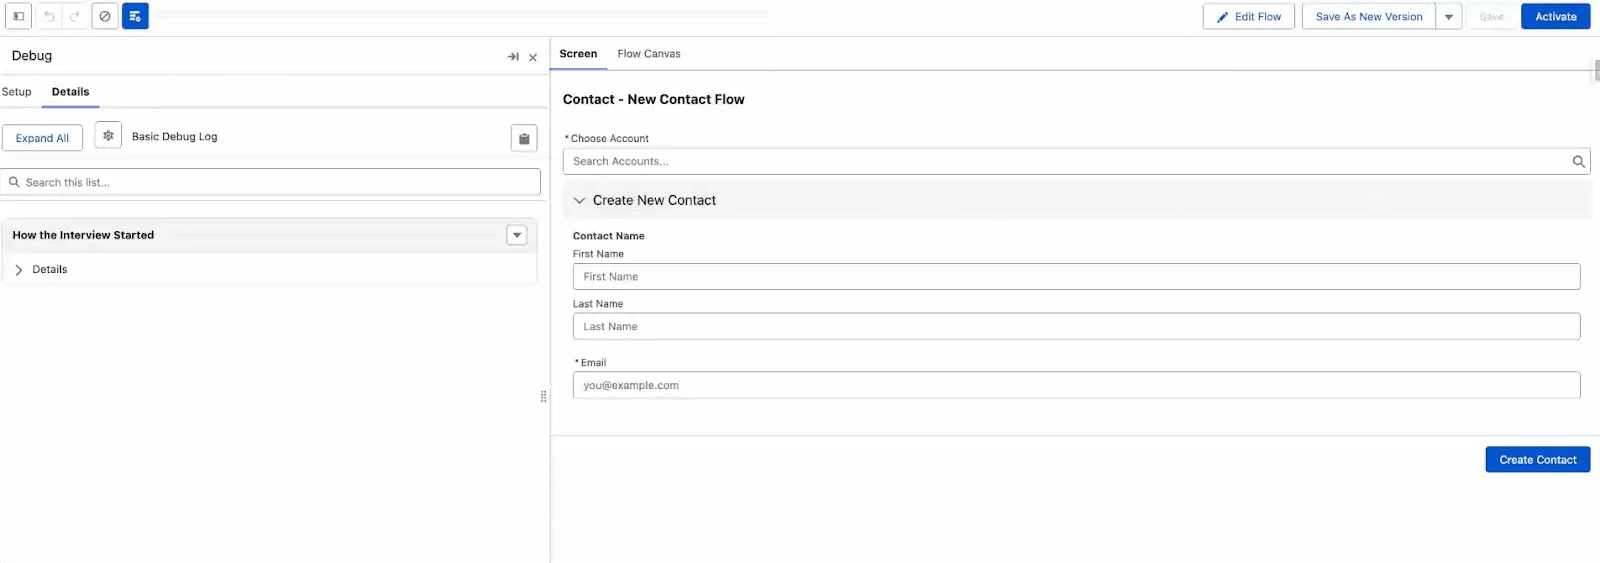
- Clicking the Debug button no longer opens a new tab, but rather a side panel on the left-hand side.
- Debug options and input variables stay the same in terms of what can be chosen, but they also appear on the panel rather than in a separate modal.
- By triggering the debug run, the side panel will display the debug details, but the rest of the screen will offer a tab-like experience for you to switch between the current screen of the process and the Flow Canvas.
So ultimately, everything will now happen in one browser tab, with the possibility to navigate the screens, the canvas, and the details of the debug run. Isn’t that a dream come true?
Similar to how it behaves for the other flow types, the Debug Panel can be expanded, the details can be searched, and the entire output can be copied to the clipboard with a click. Additionally, for each tile in the debug run, you can use the action to view that specific element in the canvas – this will come in handy whenever changes are needed following the debug result, especially within complex flows, since the action will highlight it.

Flexible display experience and actions aside, even more details can be easily perused through the debug results. The debug details include the general flow interview details, all of the screen elements, all of the components, as well as any Screen Actions or Action Buttons.
For each Screen Action, as well as for any Screen Component, you will now have the exact input and output available, and they are also searchable. On top of this, Lightning Web Components, as well as Aura local actions, can be debugged in the context of the flow.
While debugging Screen Flows, also keep in mind that:
- In the Debug Options, you can choose to run the flow as another user to replicate the exact experience they will have. This option can be turned on in Process Automation Settings in sandboxes or developer editions.
- The Flow version has to be saved before debugging. Already activated flows can be debugged as well.
Final Thoughts
Whether you’re an expert Flownatic or just getting started with Salesforce Flow, debugging and testing tasks should always be on your to-do list before activating and deploying an automation. The new debugging experience, now available for Screen Flows as well, can make this task much faster, insightful, and overall pleasant.
It’s finally time to forget about new tabs, hidden mysteries, and never-ending scrolling to find what you need! Have you already tried out the new debug panel in Screen Flows? Let us know in the comments below.


Comments: