You can do almost anything with the Salesforce REST API, but it can be a heavy lift for a developer. You have to call API endpoints, unpack JSON results, and combine results from different endpoints.
Steampipe is an open-source tool that radically simplifies the process. It enables developers to:
- Write simple SQL queries that ask common questions (e.g. “How many wins in Q2?” or “Which leads are hot?”) and populate database tables with the answers.
- Create interactive dashboards that render query results as tables, charts, infocards, and more.
- Combine results from Salesforce APIs with results from other APIs.
Here’s a short screencast that illustrates all of these capabilities:
In this guide we’ll cover how to set up Steampipe in your Salesforce, some basic SQL queries, and other Steampipe uses, as well as how to edit your dashboard.
How to Get Started
Here’s how to get started with Steampipe + Salesforce:
1. Install Steampipe
2. Install the Salesforce plugin:
steampipe plugin install salesforce
3. Create a Connected Application and configure the plugin to use its credentials
4. Run Steampipe:
steampipe query
5. Query the API. For example:
select * from salesforce_contact
The plugin provides these tables by default:
salesforce_account
salesforce_account_contact_role
salesforce_asset
salesforce_contact
salesforce_contract
salesforce_lead
salesforce_object_permission
salesforce_opportunity
salesforce_opportunity_contact_role
salesforce_order
salesforce_permission_set
salesforce_permission_set_assignment
salesforce_pricebook
salesforce_product
salesforce_user
salesforce_{object_name}
The Steampipe hub provides documentation and examples for each of these tables. But in fact there are many more Salesforce tables available.
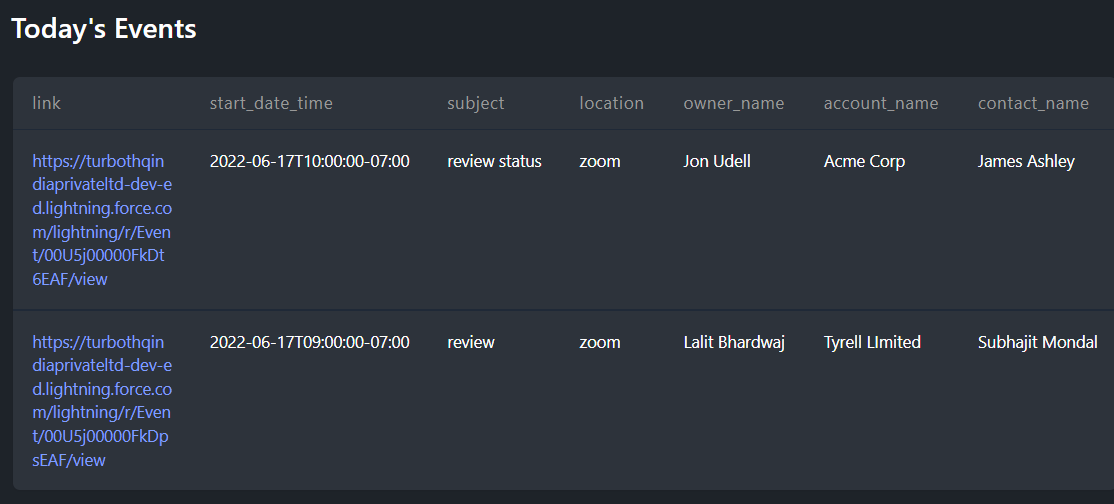
The last item in the list, “salesforce_{object_name}” is a placeholder for other APIs that you can materialize by naming them in a configuration file. The “Today’s Events” panel, for example, uses the “salesforce_event” table made available in that way.
Basic SQL Queries
The command “steampipe query” launches a console where you can interactively explore the available tables. There you can use the “.inspect” command to review the columns available in each table.

You can write simple queries to ask and answer questions. For example:

And you can join across APIs. For example the query that drives the “Today’s Events” panel shown above combines information from four tables. Salesforce Developers typically use other programming languages to do this API access and consolidation. Here’s a concise and elegant alternative:
select
   e.start_date_time,
   e.subject,
   e.location,
   u.name as owner_name,
   a.name as account_name,
   c.name as contact_name
from
   salesforce_event e
join
   salesforce_account a on e.account_id = a.id
join
   salesforce_contact c on e.who_id = c.id
join
   salesforce_user u on e.owner_id = u.id
Joining Salesforce APIs With Other APIs
The Salesforce plugin is just one of (currently) 83 plugins that encapsulate a wealth of APIs including, all the major clouds (AWS, Azure, GCP, Oracle) and a number of other services including Twitter.
Would you like to be able to track the Twitter reach of your contacts? The dashboard shown in the screencast does that.

You’ve already seen how to use Steampipe with the Salesforce plugin to query Salesforce APIs. You can also use the Twitter plugin to query Twitter APIs. And you can join across those APIs in an easy and natural way. In this example, twitter_username__c is a custom field added to the Salesforce Contact record.
with salesforce_info as (
  select
    id,
    name,
    twitter_username__c as twitter_username
  from
    salesforce_contact
  where
    twitter_username__c is not null
  order by
    id
)
select
  s.name,
  'https://twitter.com/' || s.twitter_username as twitter_url,
  t.public_metrics->>'tweet_count' as tweets,
  t.public_metrics->>'followers_count' as followers
from
  salesforce_info s
join
  twitter_user t
on
  s.twitter_username = t.username
If you are a Salesforce developer using Java, Python, C#, or another programming language, you may be thinking: “OK, that’s pretty nice but I still prefer my own language over SQL”. No problem! You can keep using it because Steampipe is based on Postgres, and there are Postgres connectors for all the languages. So you can benefit from Steampipe even if you only use it as a convenient way to make Salesforce (and other) APIs available to your language.
While you’re evaluating that option, however, you might want to check out how easily you can use Steampipe to visualize data from those APIs on dashboards.
Running the Steampipe + Salesforce Dashboard
If you’ve completed the installation steps above, you can run the dashboard shown in the screencast from a terminal, like so:
git clone https://github.com/turbot/steampipe-samples
cd all/salesforce
steampipe dashboard
Steampipe launches the local dashboard server and invites you to visit http://localhost:9194 in a browser.

There you’ll see the dashboard shown in the screencast, as defined by file.
all/dashboard/salesforce.sp.
Editing the Steampipe + Salesforce Dashboard
Dashboards are made of SQL queries (like the ones above) wrapped in a language that binds the queries to dashboard widgets. For example, here is the first infocard shown in the screencast.

Here is the code that drives it. Pretty simple stuff!
card {
  width = 2
  sql = “select count(*) as contacts from salesforce_contact”
  EOQ
}
Charts are similarly straightforward. Here’s the ”Contacts – by lead department” panel.

And here’s the code that drives it:
chart {
  width = 5
  type = "donut"
  title = "by lead department"
  sql = <<EOQ
    select
      department,
      count(*)
    from
      salesforce_contact
    where
      department is not null
    group by
      department
  EOQ
}
How easy is it to make changes? Check out the final seconds of the screencast where a live edit turns the “Contacts – by department” chart into a “Contacts – by title” chart.
Final Thoughts
Once you’ve made a few small changes you’ll inevitably have ideas for your own dashboards. Our tutorial will help you get going. As you explore what Steampipe + Salesforce makes possible, don’t miss out on the opportunity to tap into other APIs as well. The Twitter Activity panel shown in the screencast, for example, reports the numbers of tweets and followers for Salesforce contacts whose records include Twitter usernames. Joining a Salesforce table to a Twitter table (or a table made from another API) works the same way and just as easily.
If you build something useful and would like to show it off, we’d love to learn about it in our community forum. We are an open-source community full of people who are passionate about what’s possible when it becomes easier to visualize your Salesforce data and combine it with data from other sources.


Comments: