


In a world of increasing opportunities to capture data, it is essential to understand why analytics projects fail, especially when organizations have invested so heavily in resources.
Years ago, I attended a strategic meeting with leaders from various Salesforce customers, who spoke about their experiences with data and analytics. During the meeting, one man testified that his organization had invested $500,000 in a data analytics project over the course of three years. However, when asked about the end result, he was vague and ambivalent; he struggled to define the valuable outcomes achieved – if any at all.
Three years and half a million dollars later – the question is, for what purpose? In my experience, this is not the exception – it is the norm. The failure rate of data and analytics projects is staggering:
- From now until 2022, only 20% of analytic insights will deliver business outcomes. (Gartner)
- 87% of data science projects never make it into production. (Venturebeat)
- In 2016, Gartner estimated that 60% of big data projects failed. A year later, Gartner analyst Nick Heudecker put the failure rate at 85%. (TechRepublic)
Having spoken with many organizations across a broad spectrum of industries and segments, most data analytics projects I have observed have followed this trend; projects have been largely unsuccessful, with business outcomes mediocre, at best. This is a platform-agnostic observation – whether an organization is using Tableau, Tableau CRM, Salesforce, PowerBI, Apache Spark, or Excel, we see a general pattern of dissatisfaction and frustration.
Inevitably, the question to ask is, why do analytics projects fail? There are a great many reasons, but we are going to focus on the top six.
1. Ambiguous Deliverables and Conflicting Interests
Many business intelligence (BI) projects fail due to a lack of clear, explicit, and agreed goals and outcomes; analytics customers are not necessarily clear on what they need or want, and the supplier (internal or external) is often left in the dark.
A set of clearly defined deliverables may be seen as a given before embarking on a BI project, settled well before seeking approval, obtaining funding, etc. However, this is often not the case.
Ultimately, many organizations don’t know what they don’t know. While they may be confident that they understand their BI gaps (and what is required to fill them), their goals are vague, conflicting, uniformed; either too detailed or not detailed enough; changeable, ambiguous, or unilateral, with no internal consensus.
So, what should BI customers do when defining project goals and deliverables?
- Identify their desired business outcomes.
- Align with high-level strategic objectives.
- Define SMART deliverables.
A common cause of project failure is an inability to align internally on goals and deliverables, often due to poor cooperation, communication, and collaboration.
Let me give you an example.
As I sat with an important client in one of many discovery and design workshops, I observed the chaotic proceedings with a mixture of curiosity and frustration. The session deteriorated into an unprofitable and disorganized debate on the definition of one solitary business metric, with battle lines drawn between two opposing points of view.
I suggested that they take this debate offline to get back to the process of discovery and design – the purpose of the meeting. Despite this, it took many months of wrangling for the organization to settle on an agreed definition, and the impact of this misalignment was a significant delay to their BI project.
Common types of misalignment include:
- Competing interests and internal politics derail project success.
- Limited or non-existent data sharing creates roadblocks in the way of meaningful insights.
- Disconnect between technical resources, business users, and business leaders, resulting in inferior outcomes.
- Neglect of end users leading to poor ownership and adoption.
Various stakeholders within the customer organization must constantly work to achieve and maintain internal alignment.
2. Actionable Insights Are Not the Focal End Goal
Actionable insights simply must be the end goal. As you consider the why of a BI project, remember that the whole point of gathering data and providing insights is to drive business outcomes – to facilitate, inform, and direct action: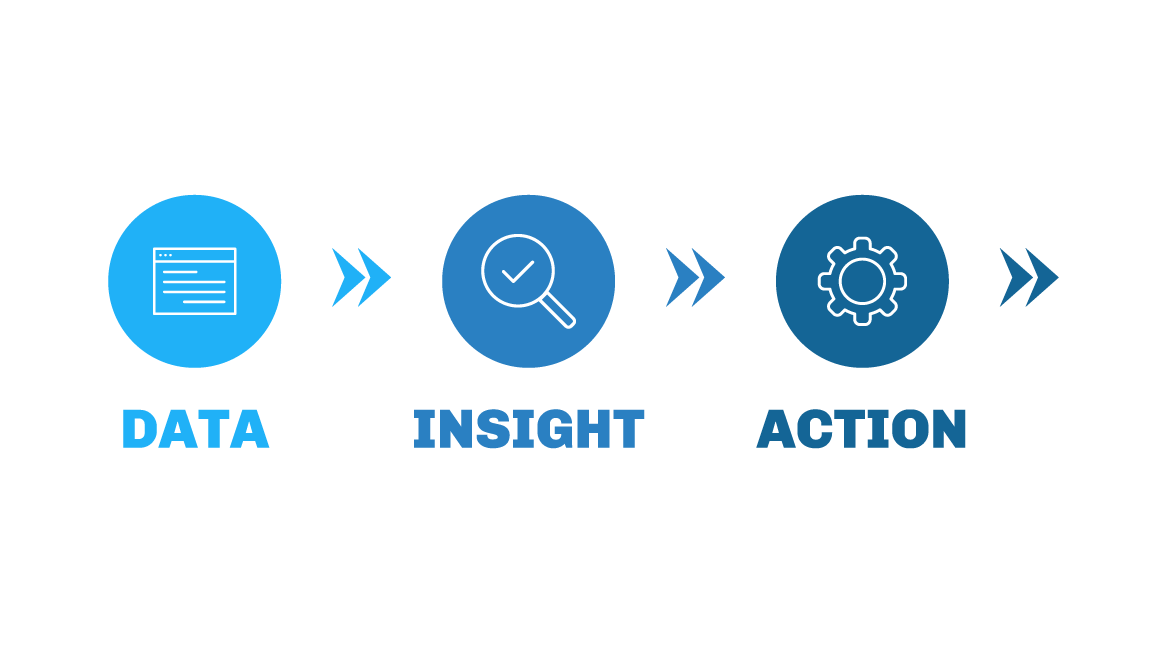
Remember, as highlighted at the start, “only 20% of analytic insights will deliver business outcomes,” and you can begin to understand why.
“Business people still struggle to know which insights to action, because, even with modern analytics and business intelligence (A&BI) platforms, insights are not contextualized, easily consumable, or actionable by the majority of users…[they] are drowning in data and, especially as the complexity of data increases, they are struggling to identify what is most important and what are the best actions to take.”
(Top 10 Trends in Data and Analytics 2020)
Insights that are not actionable – that do not drive business decisions – are fruitless and pointless. They are expensive pixels on a monitor, or print on a page, that represent a waste of time and money.
The whole point of BI projects is to drive business outcomes by enabling decision-makers with accurate and pertinent information. Without this, there is no point at all, and the project cannot possibly deliver a great (or even a mediocre) result.
3. A Lack of Leadership and Ownership
As the saying goes, “everything rises and falls on leadership.” (Dr Lee Roberson)
In order for a BI project to succeed, there must be clear, accountable product ownership on both sides of the equation – with the customer and with the consultant.
The project owner may often act as a “champion” to the project, in partnership with the sponsor. The project/product owner must be responsible and accountable – after all, where there is no accountability, there can be no true success.
Here are five key areas to focus on:
- Goals – sign off on agreed goals and outcomes
- Roles and responsibilities – we use a RASIC matrix in our business: Responsible, Approve, Support, Inform, Consult.
- Governance – accountable for timely and quality delivery on a milestone-by-milestone basis; not for managing at a granular task level.
- Leadership – building and maintaining internal support and momentum for the project vision and deliverables.
- Communication – Provide feedback and sign off work results.
Executive sponsorship is a critical facet of project leadership. A data analytics project that is missing the backing of a senior business leader is doomed to fail right from the start.
Even if many internal stakeholders are excited about the BI project, the absence of an executive sponsor will seriously hinder business outcomes. In fact, the project could be completely derailed, even abandoned, due to this lack of executive sponsorship.
Consistent executive sponsorship contribute massively to projects:
- Continued availability of key resources, such as people and funding.
- Alignment of project deliverables with business outcomes.
- Removal of organizational roadblocks.
- Expedition of delayed resources and deliverables.
- Resolution of internal conflicts and misalignment.
Our team of consultants once delivered best-in-class analytics for an amazing not-for-profit organization, and the client was thrilled with the results – their team went from taking three days to manually build a cross-object report in Excel to having a dynamic, accurate, self-serve Tableau CRM dashboard available to team members.
The capacity to scale this solution beyond the small initial team of stakeholders was promising, as well as the potential to deliver transformational results throughout the broader organization. The project team was keen to facilitate, however, due to the absence of executive sponsorship, the idea went no further, and significant gains were forgone.
Executive sponsorship is absolutely critical for BI project success. If you don’t have it, get it!
4. Lack of an Agile Approach
As a general rule, a waterfall approach to project management and delivery does not work for BI projects – primarily because this approach relies heavily on a clearly defined set of requirements at the outset. This is extremely difficult, if not impossible, for most BI projects as the customer simply does not know what they need or how to get it.
A flexible, experimental, and iterative approach is required – an ‘agile BI’ approach: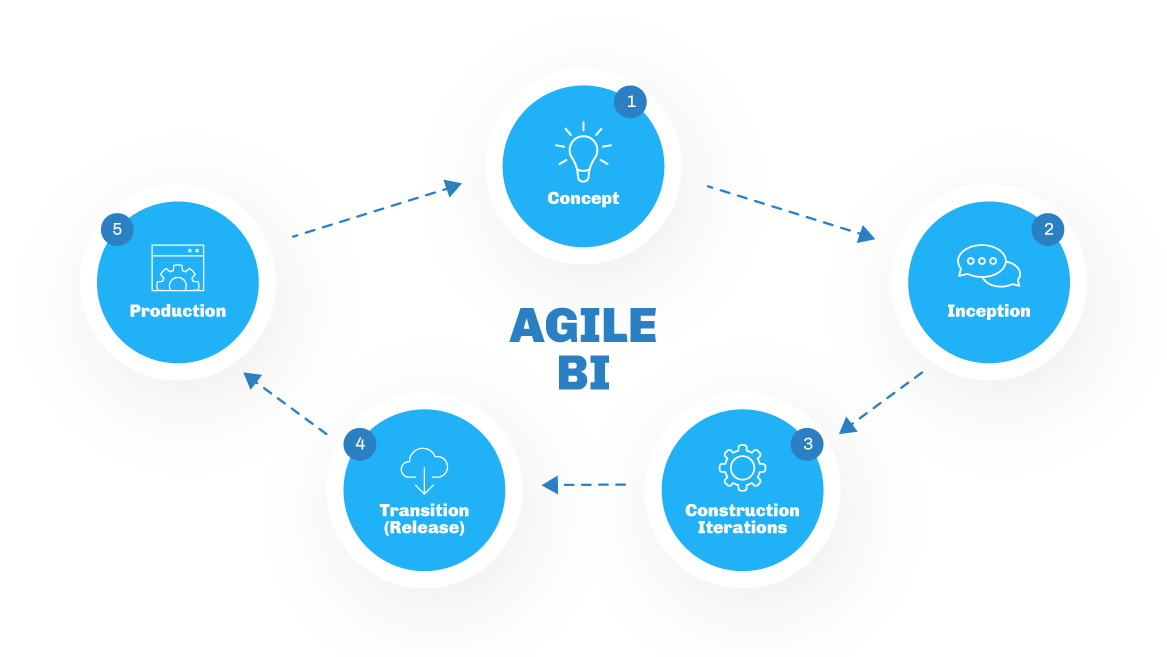
- Concept: Working with the customer (whether as an internal or external service provider) in interactive workshops, define and build a rough mock-up of the first iteration.
- Inception: Based on customer feedback on the mock-up, design and build an initial prototype dashboard using real data (full or partial).
- Construction Iterations: Hands-on customer testing of the prototype by various stakeholders and personas creates a closed feedback loop, which is incredibly powerful:
- Test
- Review
- Build
- Test (multiple iterations until the MVP is built)
- Transition (release): The MVP is released to test users, accompanied by training, mentoring, and support, as the project team prepares to release to production for all business users.
- Production: Once the MVP is live in the real world, a simple feedback mechanism is provided to facilitate continuous improvement – taking you back to Step #1.
Keep in mind that the goal must be progressing, not perfection. In my experience, the consequences of not taking an MVP (minimum viable product) and roadmap approach are catastrophic.
Identify the high-priority project deliverables that will form the MVP, agree on the parameters of success for these deliverables, and stay focused – perfection can wait! Progress is the key.
Years ago, we worked with a large business to deliver a Tableau CRM MVP to enable the go-live of their new Salesforce implementation. The initial design from our team was simple and minimalist, and the client was extremely pleased. However, one key stakeholder at their end came to the table with a gigantic and exhaustive list of BI requirements based upon their legacy analytics.
Instead of sticking to a minimalist MVP design, as originally proposed and agreed upon, the client got sidetracked by that one influential individual. The project was, to some extent, sabotaged. It took many months to recover and make true progress. If the business had stuck to the original strategy of a minimalist MVP and a road map, the results would have been far superior.
5. Poor Data Integration
It might be a cliché, but the old adage holds true:
Garbage In = Garbage Out
Incomplete and inaccurate data never results in accurate, useful insights; your dashboards are only ever as good as the data that feeds them.
I encountered a real-world example in the area of marketing segmentation analytics and personalized email communications. The business spent a great deal of money investing in the cutting-edge marketing automation platform, Pardot. They then paid me a considerable sum to implement and configure the system to match their desired outcomes around lead generation and nurturing.
The end result was an innovative and powerful solution that even caught the attention of the Pardot product team. However, several of us flagged a risk early on in the design phase – the data required to drive segmentation and personalization was seriously lacking in quality and completion. The business outcome was suboptimal because the first-class framework was powered by third-class data.
Many businesses seek to overcome poor (or nonexistent) data integration with manual processes. Beware: manual enrichment of data is slow, tedious, and error-prone, and it often doesn’t even take place at all, leaving datasets terribly inadequate for driving useful analysis. In fact, the resulting dashboards are counter-productive and dangerous, because they deliver misleading insights!
You can have the smartest people, the best technology, and the clearest vision, but you will never succeed without data that is:
- Current
- Correct
- Consistent
- Complete
6. No Plan for Ongoing Development
Data and dashboards have a half-life. That is, the value that they provide naturally deteriorates over time, necessitating a deliberate strategic plan to continually develop analytics assets. Why? Changes occur in:
- Business models and processes
- Systems and data architecture
- The socioeconomic landscape
- Business leadership
- Performance metrics
A great example is the recent impact COVID-19 had on businesses, and on the world in general. Machine learning models that trained using 2019 data are almost certainly defunct. Business models have been turned upside down almost overnight, with societies and economies disrupted in a matter of months. Some businesses have thrived, and others have failed, often due to factors totally outside of their control.
How many analytics dashboards and predictive models that were created in 2019 are now useless? Unfortunately, the answer is ‘a great many’.
We worked with a large business to deliver a proof of concept (POC) around forecasting demand for their services. However, just as we engaged, COVID hit the world. The impact on our client’s business was a 95% increase in demand for May 2020, compared to the same period in 2019. With the basis of predictive insights being the intelligent extrapolation of historical trends into the near future, how could any predictive solution possibly deliver accurate forecasts with the world in constant flux?
What factors lead to the eventual deprecation and abandonment of analytics dashboards and predictive models? Here are my top ten:
- No development road map.
- No process of continual feedback and improvement.
- Lack of ownership of the BI strategy and assets.
- Lack of development of human resources – training and equipping does not support the road map.
- No vision for growth and innovation.
- Lack of business resources to support fixes and enhancements.
- Limited or non-existent development of platform and data integration.
- Poor user ownership and adoption.
- Failure to foster a culture of growth innovation.
- A mindset of contentment – “we have arrived”.
The business impact of this ‘half-life’ of analytics and insights is huge. The dashboards of organizations that have neither the strategy nor the resources for ongoing development are doomed to failure.
What does a plan for analytics development look like? It is the exact opposite of the points above:
- A clear and agreed development road map.
- A documented and implemented process of continual feedback and improvement.
- Clear ownership of the BI strategy and assets.
- Deliberate and strategic development of human resources – training and equipping that supports the road map.
- A simple and unambiguous vision for growth and innovation.
- Adequate business resources to support fixes and enhancements.
- Ongoing development of platform and data integration.
- Strong user ownership and adoption.
- Fostering a culture of growth innovation.
- A mindset of healthy discontentment – “we have not arrived”.
Summary
As emphasized throughout this guide, most BI and analytics projects are destined to fail because they lack integral parts of the process. So, what are you going to do differently?
Now that you know what not to do, the onus is on you to have a clear plan in place to avoid (or address) these failings, and to support your plan with the necessary resources. After all, you don’t want to be part of the 80% creating insights, only for them to sit on the shelf unseen, right?


Comments: