“Slow is smooth, smooth is fast, and fast makes all the difference.”
I heard that line plenty of times during my military career, usually when we were doing something repetitive or high-stakes, from marching drills to operational planning overseas. Funny enough, that same principle stuck with me when I moved into the Salesforce and RevOps world.
In analytics and reporting, it’s tempting to move fast by chasing quick fixes, cloning reports, or building dashboards on the fly. But taking the time to slow down and set things up the right way will actually make you faster in the long run. If you’ve ever lost hours in Lightning Report Builder trying to find a report using a certain field you need to delete, this is for you.
My goal is simple: help you save time, work smarter, and look like the organized, thoughtful RevOps pro that everyone wants on their team.
1. Reduce and Reuse
We’ve all done it. You can’t find the right report, so we just make a new one. It feels quicker, but it creates clutter. The better move is to standardize: define your naming conventions, must-have columns, and filter logic so reports are easy to reuse.
Here’s a quick win: cut redundant columns. If the report is already filtered to “Closed Won,” you don’t need a “Stage” column. When scanning your report from left to right, ask yourself:
- Who’s reading this?
- What story am I trying to tell?
- Can I remove anything without losing clarity?
Simplify the view, collapse detailed rows, and focus on trimming the visual noise. You’ll be surprised how much faster analysis gets when your reports are lean and standardized.
Example of what not to do:
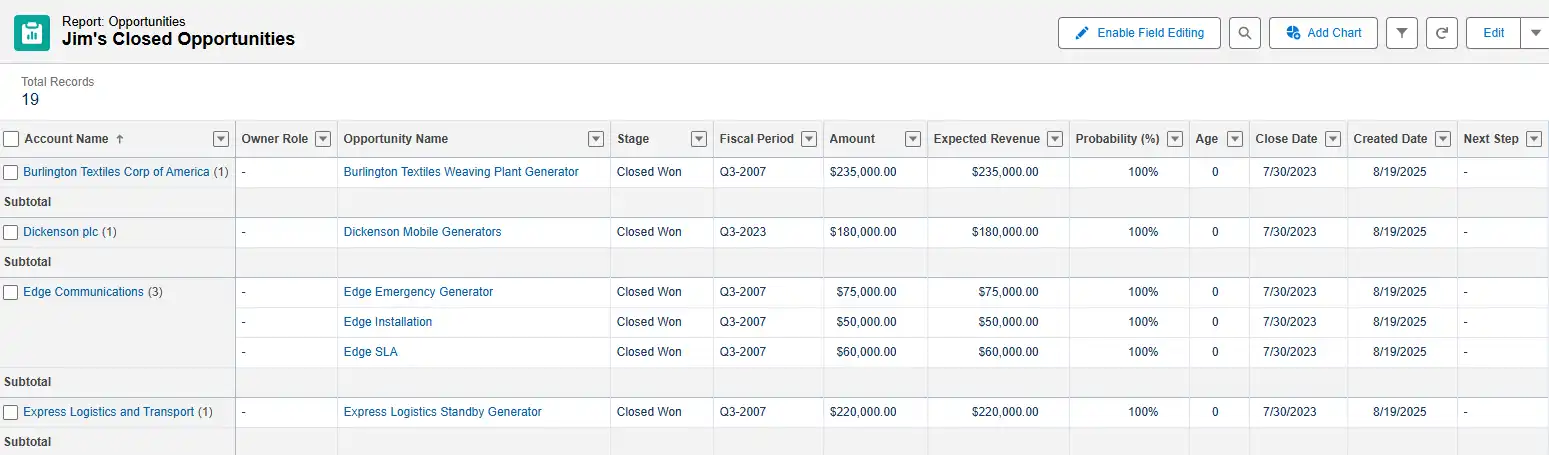
Take note of the factors that make this a cluttered and redundant report:
- Incomplete data in columns.
- The title is for a generic first name of a person and does not specify a date range.
- Stage is in the title and the filter as Closed Won.
- Multiple revenue columns (which is the priority?).
- Probability is not needed either since it’s already 100% at Closed Won in most orgs.
Here’s a better example:
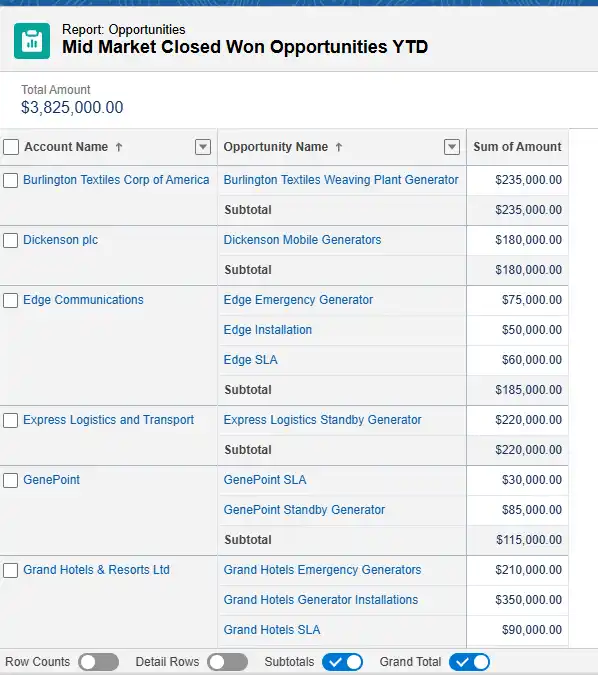
- Descriptive and accurate title.
- Detailed Rows are collapsed.
- One revenue metric.
- Opportunities sub-totaled per Account (optional).
Remember to clean up the detailed columns so that when someone drills down into the data, it is still consolidated even when more details are requested.
2. Organize and Label Everything
Small details matter. Titles written in ALL CAPS feel like someone’s shouting. Messy names make it hard to find what you need. Take a minute to label your reports the way you’d label files for someone else to use.
Write titles that reflect the main focus of the report. Instead of “John’s Sales”, you should write “Closed Won Opportunities – John”.
Even better would be to avoid using the personal name of someone and just make the report dynamic using the “My Opportunities” filter and label the report as “My Closed Won Opportunities – AE Version”.
Lastly, don’t forget to use the description field – it’s there for a reason.

3. Gone in 60 Seconds
Every dashboard should tell one story with one source of truth, if possible. When I build, I start with a single dataset and adjust filters for each component. That way, whether I’m showing open pipeline or closed revenue, everything ties back to the same foundation.
From there, I structure the view so it flows logically with total sales at the top, then pipeline, then breakdowns by team or segment. The goal is for someone to look at it and get the story in under a minute. If they need to stare at it for longer, it’s probably too complicated.
And when you’re designing a dashboard, think visually: people read from top to bottom and left to right. Make sure the first thing they see is what actually matters: move the key metrics up top, hide the distractions, and make it intuitive for anyone to understand what they’re looking at in seconds.
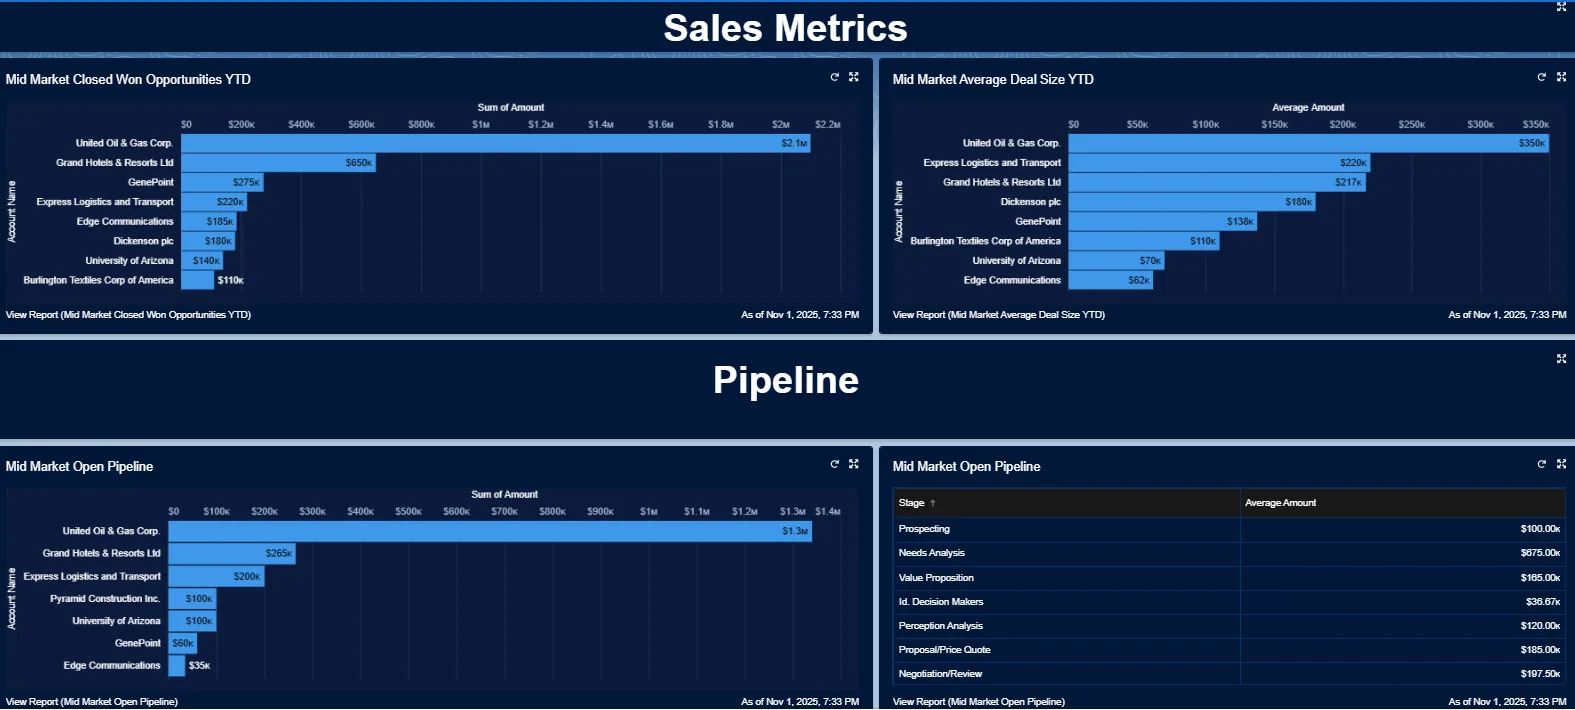
In the following dashboard example, you will see the thought process starts with answering “How much did we sell so far YTD in Mid-Market by top accounts?”. Next, it shows a little more detail, like “What was the average deal size per account?” And then a second section is split up by a text banner, leading the eyes to the Open Pipeline reports.
One report answers a similar account-based open pipeline question, while the next report to the right breaks down how much revenue, on average, is in each stage currently. These are all built on similar reporting data, just with a few filters and visual adjustments.
4. Create Documentation to Align Your Teams
Nothing slows a RevOps team down faster than a dozen versions of the same report. I’ve seen it too many times: each team building their own “truth.” The fix is a framework, a standard operating procedure (SOP), an agreed-upon set of rules. You need something in writing to ensure you’re all speaking the same language.
Back in the military, we had SOPs for everything because consistency removes guesswork. Apply that thinking to your reporting. Decide as a team what filters and fields go into your standard Opportunity, Account, Contact, Lead, and Case reports. Document it. Store it somewhere everyone can find it.
When your team works from the same playbook, your reports start telling the same story, and leadership starts trusting the data again.
5. Clean Up and Archive Reports
If nobody’s opened a report in six months, it’s probably not worth keeping.
Run a “report of reports” using a custom report type (Reports as the primary object, Dashboards as a secondary). This lets you see usage and dependencies so you can archive safely. Over time, this kind of cleanup reduces tech debt and makes it easier to manage the reports that actually matter.
Final Thoughts
If I could go back and apply these habits earlier in my career, I would have saved myself and my team a lot of headaches. That’s why I share them now.
“Slow is fast” isn’t just a catchy saying. It’s how you build sustainable, trustworthy reporting. When you build structure and discipline into your reporting, speed comes naturally.
Take one or two of these ideas and put them into practice this week. Your dashboards and your sanity will thank you for it.
I’m always thinking of ways to optimize Salesforce, the systems it connects with, and want to hear your thoughts as well as part of this broader community called RevOps. Feel free to reach out to me on LinkedIn, and I’ll be glad to schedule some time to chat!
Slow really is fast, especially when it comes to data clarity.
