If you’ve been using Salesforce for a while, chances are you’ve got a go-to report format. Most people do, as reports are probably one of the most commonly used features in Salesforce. The problem is that sticking with what’s familiar means you may be leaving a better, cleaner report on the table.
There are five report formats to work with: Tabular, Summary, Matrix, Joined, and Custom. And while they’re easy enough to tell apart on the surface, it’s surprisingly common to see the wrong one used in practice. This article breaks down what each format or type is actually for, where people tend to go wrong with it, and when it genuinely makes sense to use it. Let’s dive in!
1. Tabular Reports
Ah, the simplest one on the list! It’s a flat list of records displayed in rows and columns – like a simple spreadsheet pulled straight from Excel. No fluff like groupings, subtotals, or even charts. It tends to be the default type that users gravitate towards because of its simplicity and easiness to build.
However, that simplicity is also its biggest limitation. Because there’s no grouping or aggregation, tabular reports can’t produce charts on their own and aren’t really great for analysis. There’s no visualization that can be taken from this, so they’re also not ideal for dashboards unless you’re using them purely to display a list.
One common way that people are using this incorrectly is doing a tabular report when what they actually need is a summary (more on that type later). If someone asks, “How many opportunities did each rep close this quarter?”, a tabular report cannot answer it because that would involve grouping according to rep!
Use it when you just need a quick, exportable list of records. For example, do you need to pull all contacts in a specific region and hand them to someone in a spreadsheet? Great, a tabular report is the most straightforward way to do this! Another one is if you need to mass-update records and want a clean view to work from first. Tabular reports are fast to build and easy to share in this case.
2. Summary Reports
A summary report starts with the tabular report! It’s essentially a tabular report with groupings. That singular addition changes the format entirely.
Groupings are powerful because it enables you to organize records by a shared field. Imagine grouping by Opportunity Owner, Account, Stage, or Region, for example – from there you can then get subtotals and even aggregate values per group. This is what makes summary reports useful for actual analysis, and it’s also what makes charts and dashboards possible. Hooray for visualization!
This is your workhorse report format. The question “How many opportunities did each rep close this quarter?” that I mentioned earlier can be answered by this kind of report. Anything where you want to see “how much per group” makes the summary report the accurate report type for it.
Be cautious about grouping by too many levels at once, though, because you can easily end up with something that takes three scrolls to make sense of. Summary reports support up to three row groupings, but that doesn’t mean you should always use all three! To analyze data with more than three levels of grouping, you must use a joined report (we’ll discuss this later) or utilize custom formulas instead.
Formulas in Summary Reports
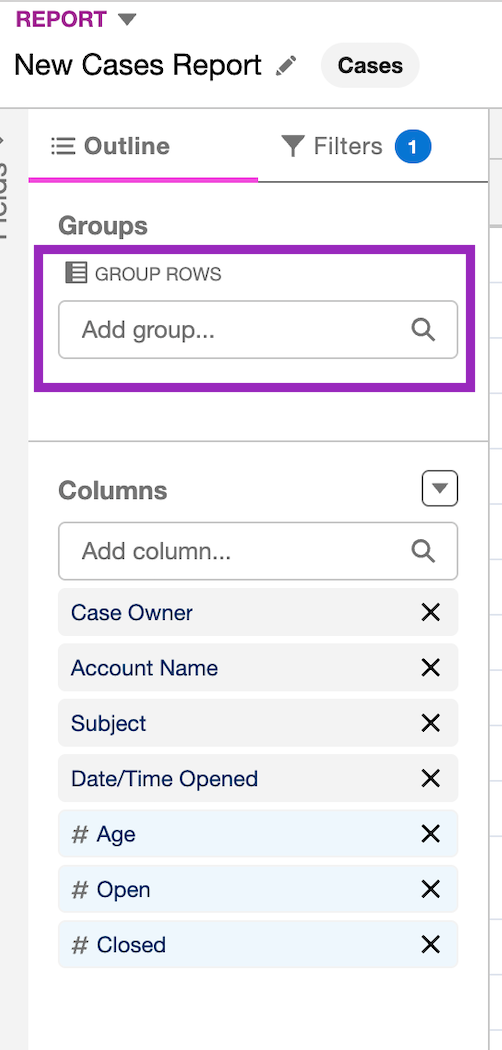
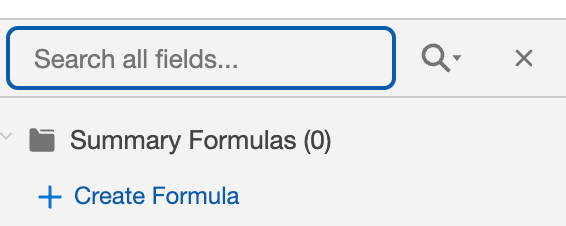
Summary formulas calculate data at the grouping (subtotal) or grand total level. They’re perfect for computing custom metrics like win rates or averages. You can have up to five formulas per report. When viewing fields in Edit report, just click the Create Formula link.
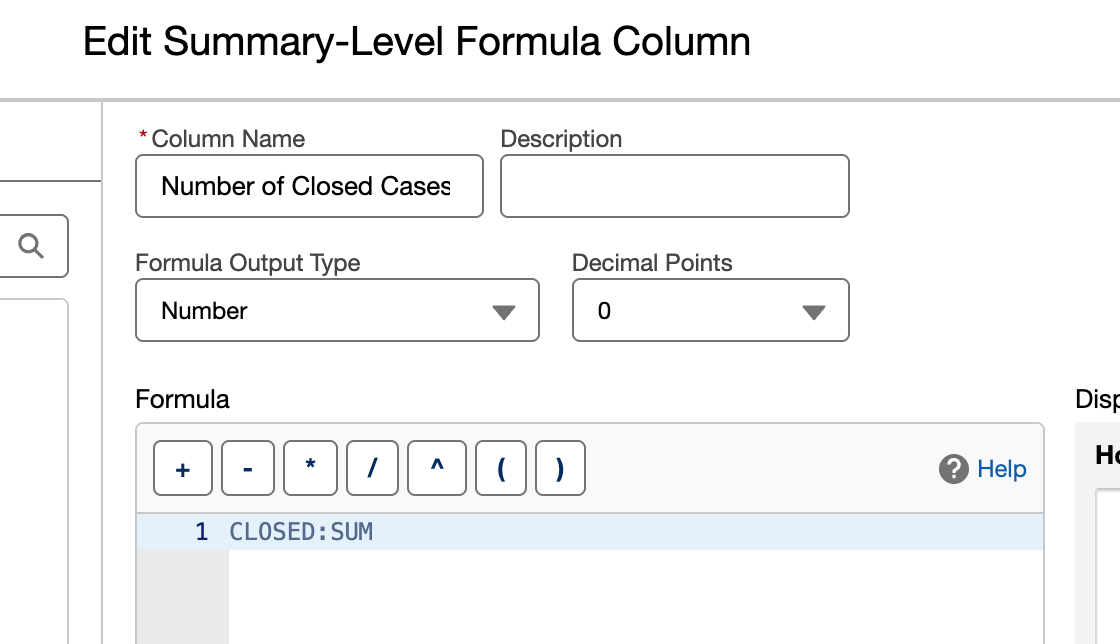
Here’s a simple formula that finds the sum (or number) of Closed cases:
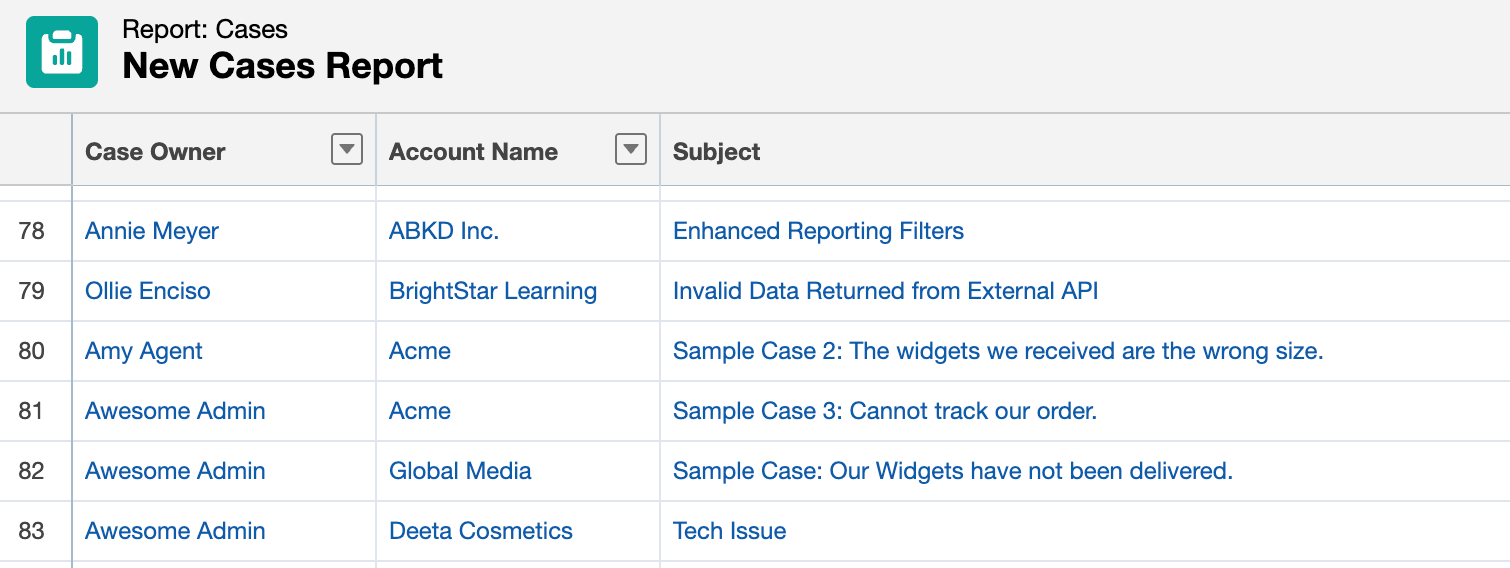
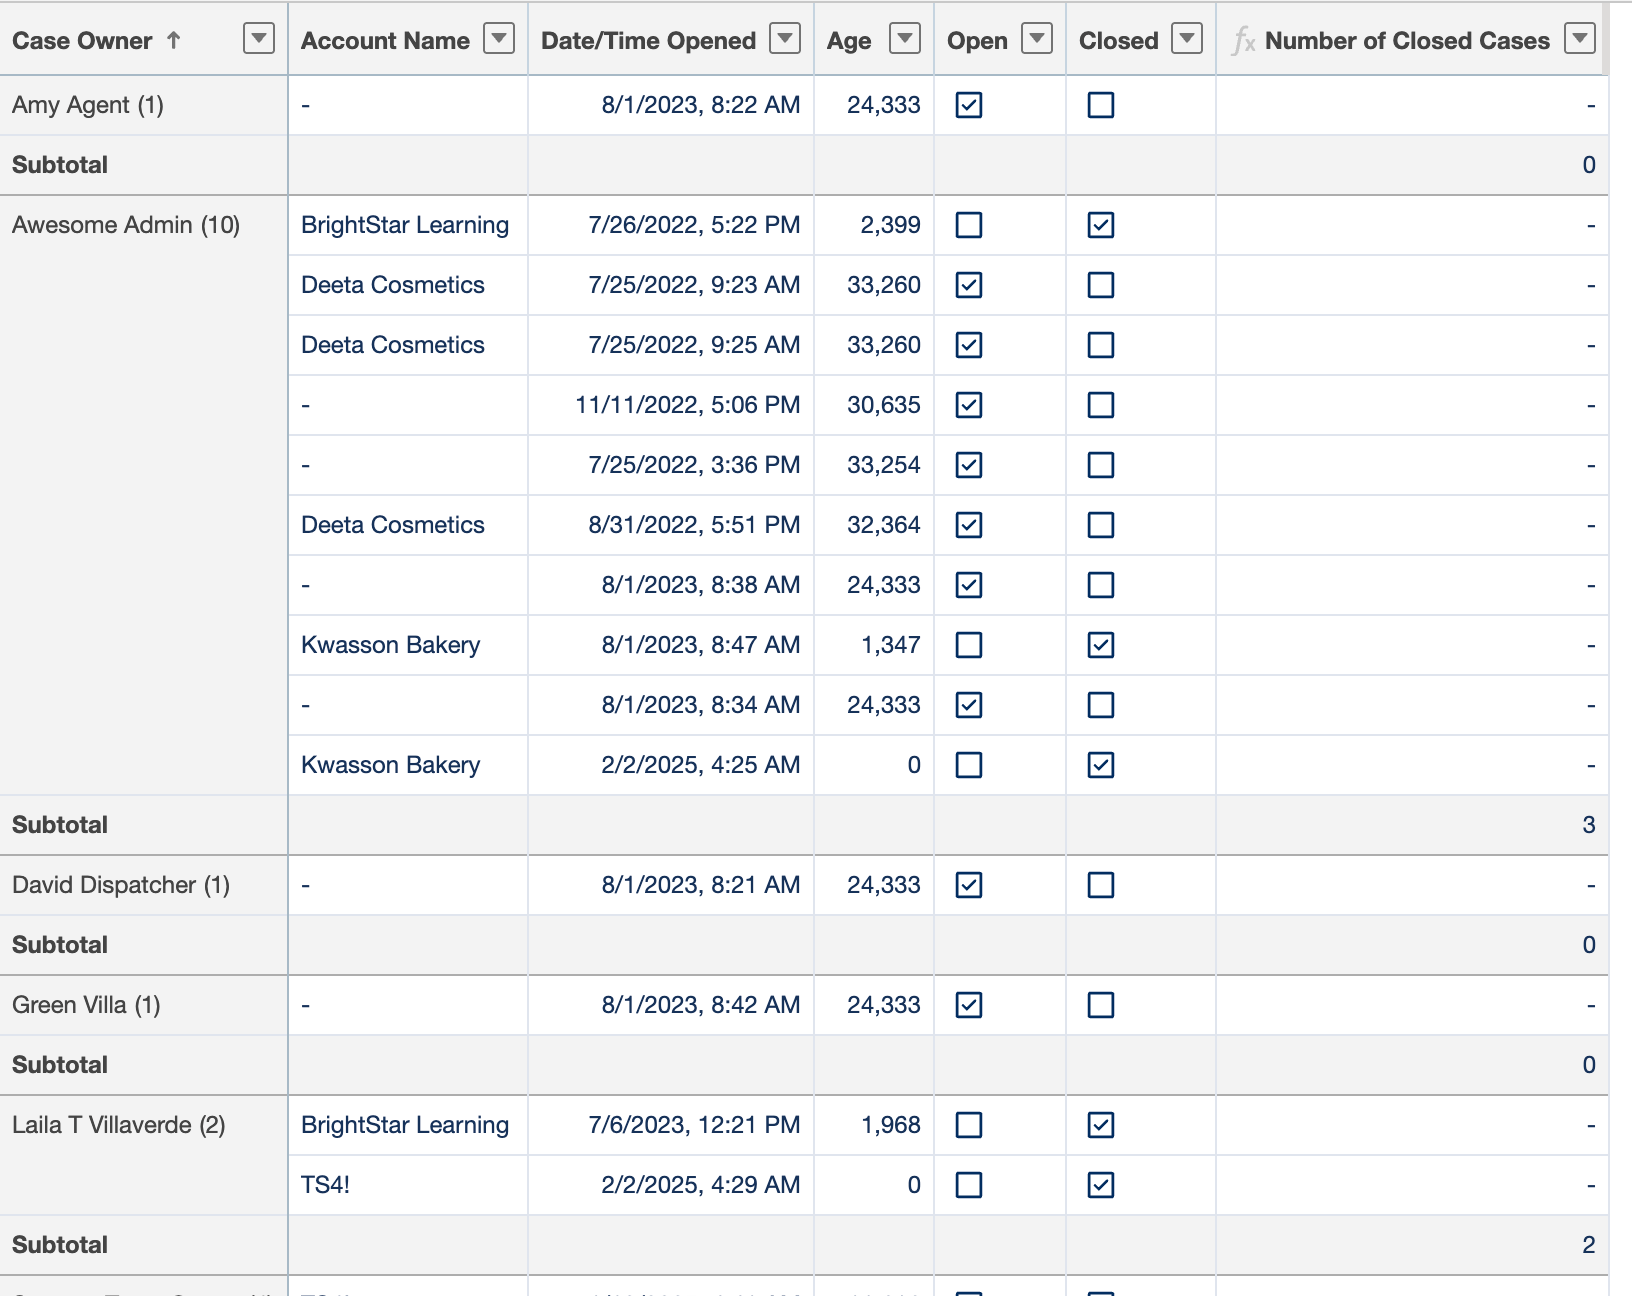
When applied to the Summary report (grouped by Case Owner), it displays a separate column that shows the number of Closed cases per owner:
3. Matrix Reports
If the summary report lets you group by rows, the matrix report lets you group by both rows and columns. The result is a grid that shows aggregated values at each intersection, similar to a PivotTable in Excel! It’s the most visually complex of the four standard formats, and it’s genuinely useful when you’re comparing two dimensions at once.
One example is comparing Total Revenue, broken down by both product line (rows) and region (columns). Be careful, though, as matrix reports can also get unwieldy fast if either axis has too many values. Twenty row groups and twelve column groups produce a grid that nobody wants to look at. They are best used when the relationship between two dimensions is the actual question. For example, “How does each product perform across each region?” is a matrix question. If you only care about one dimension, consider using a summary report instead.
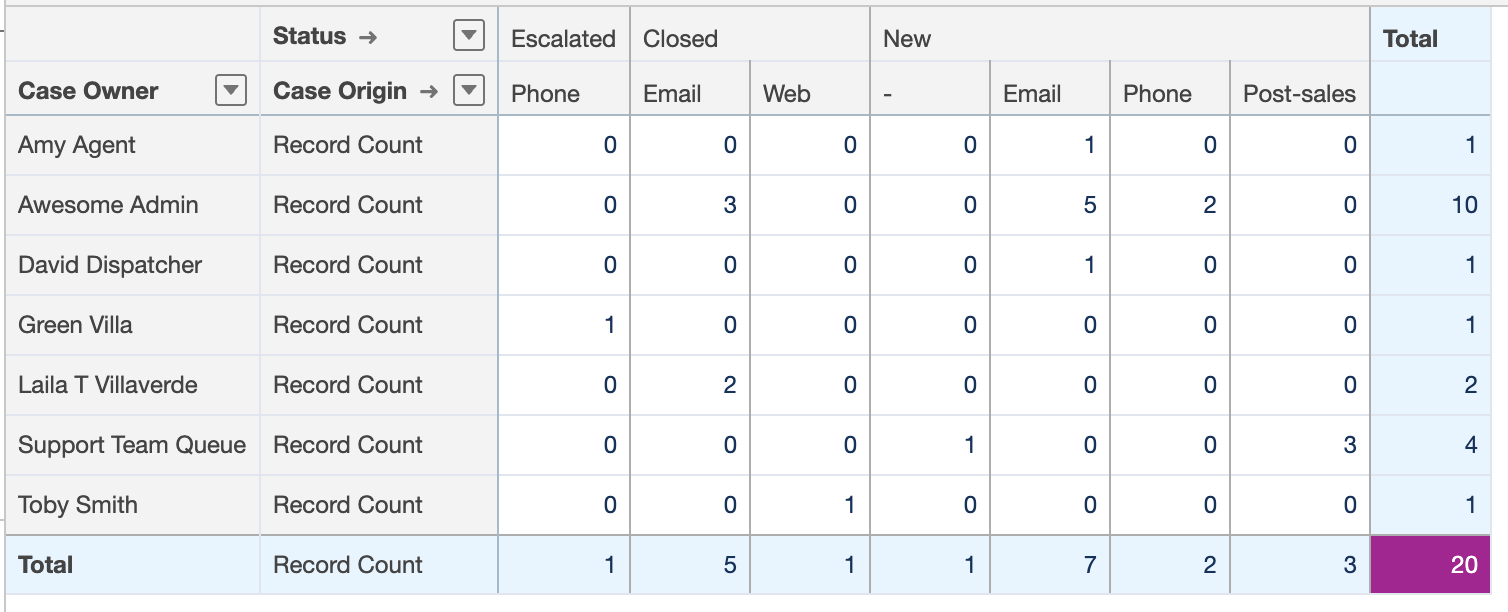
To create a Matrix report, group by rows first (basically a Summary report), then proceed to group by columns. Remember the Case report we grouped by Case Owner earlier? I’ve added two column groupings: by Status and Case Origin. The result is a grid that shows the Status and Case Origin of cases owned by each person:
4. Joined Reports
Joined reports are different from the other three report types in a meaningful way, because instead of displaying one set of records in a single format, they let you combine multiple report blocks (a maximum of five, to be exact). Each block can have its own format, filters, and columns (and can also pull from different objects).
For example, you could have one block showing Opportunities and another showing Cases, side by side, within the same view. It’s great for the purpose of having a high-level overview of things.
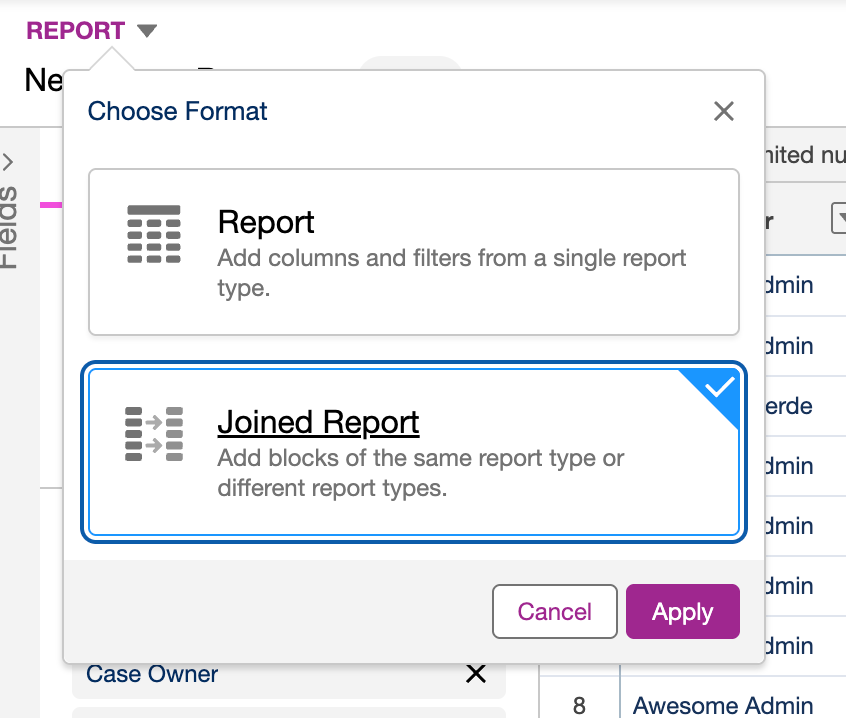
When creating your report, just click the dropdown on “Report” on the upper left and select Joined Report.
This should give you a new “Add Block” button where you can choose up to four report blocks to add to your principal report.

Joined Reports vs. Dashboards
One thing to note here is that, unlike the other report formats, joined reports cannot be used as the source for your dashboard components unless they have a chart. So, when should you use a joined report instead of a dashboard?
The difference comes down to why you’re combining the data. A dashboard is essentially a monitoring tool. Since it updates automatically, you can check it regularly. And, each component is self-contained. If you just need an ops manager to see open cases and pipeline value on the same screen, a dashboard can do the job for you.
A joined report, on the other hand, is for when the relationship between two datasets is the point. For example, say you want to show won opportunities alongside the support cases opened by those same accounts in the same period (and you need that data aligned in a single exportable view for a business review meeting), that’s where joined reports make more sense. A dashboard doesn’t really give you that row-level alignment across objects.
5. Custom Reports
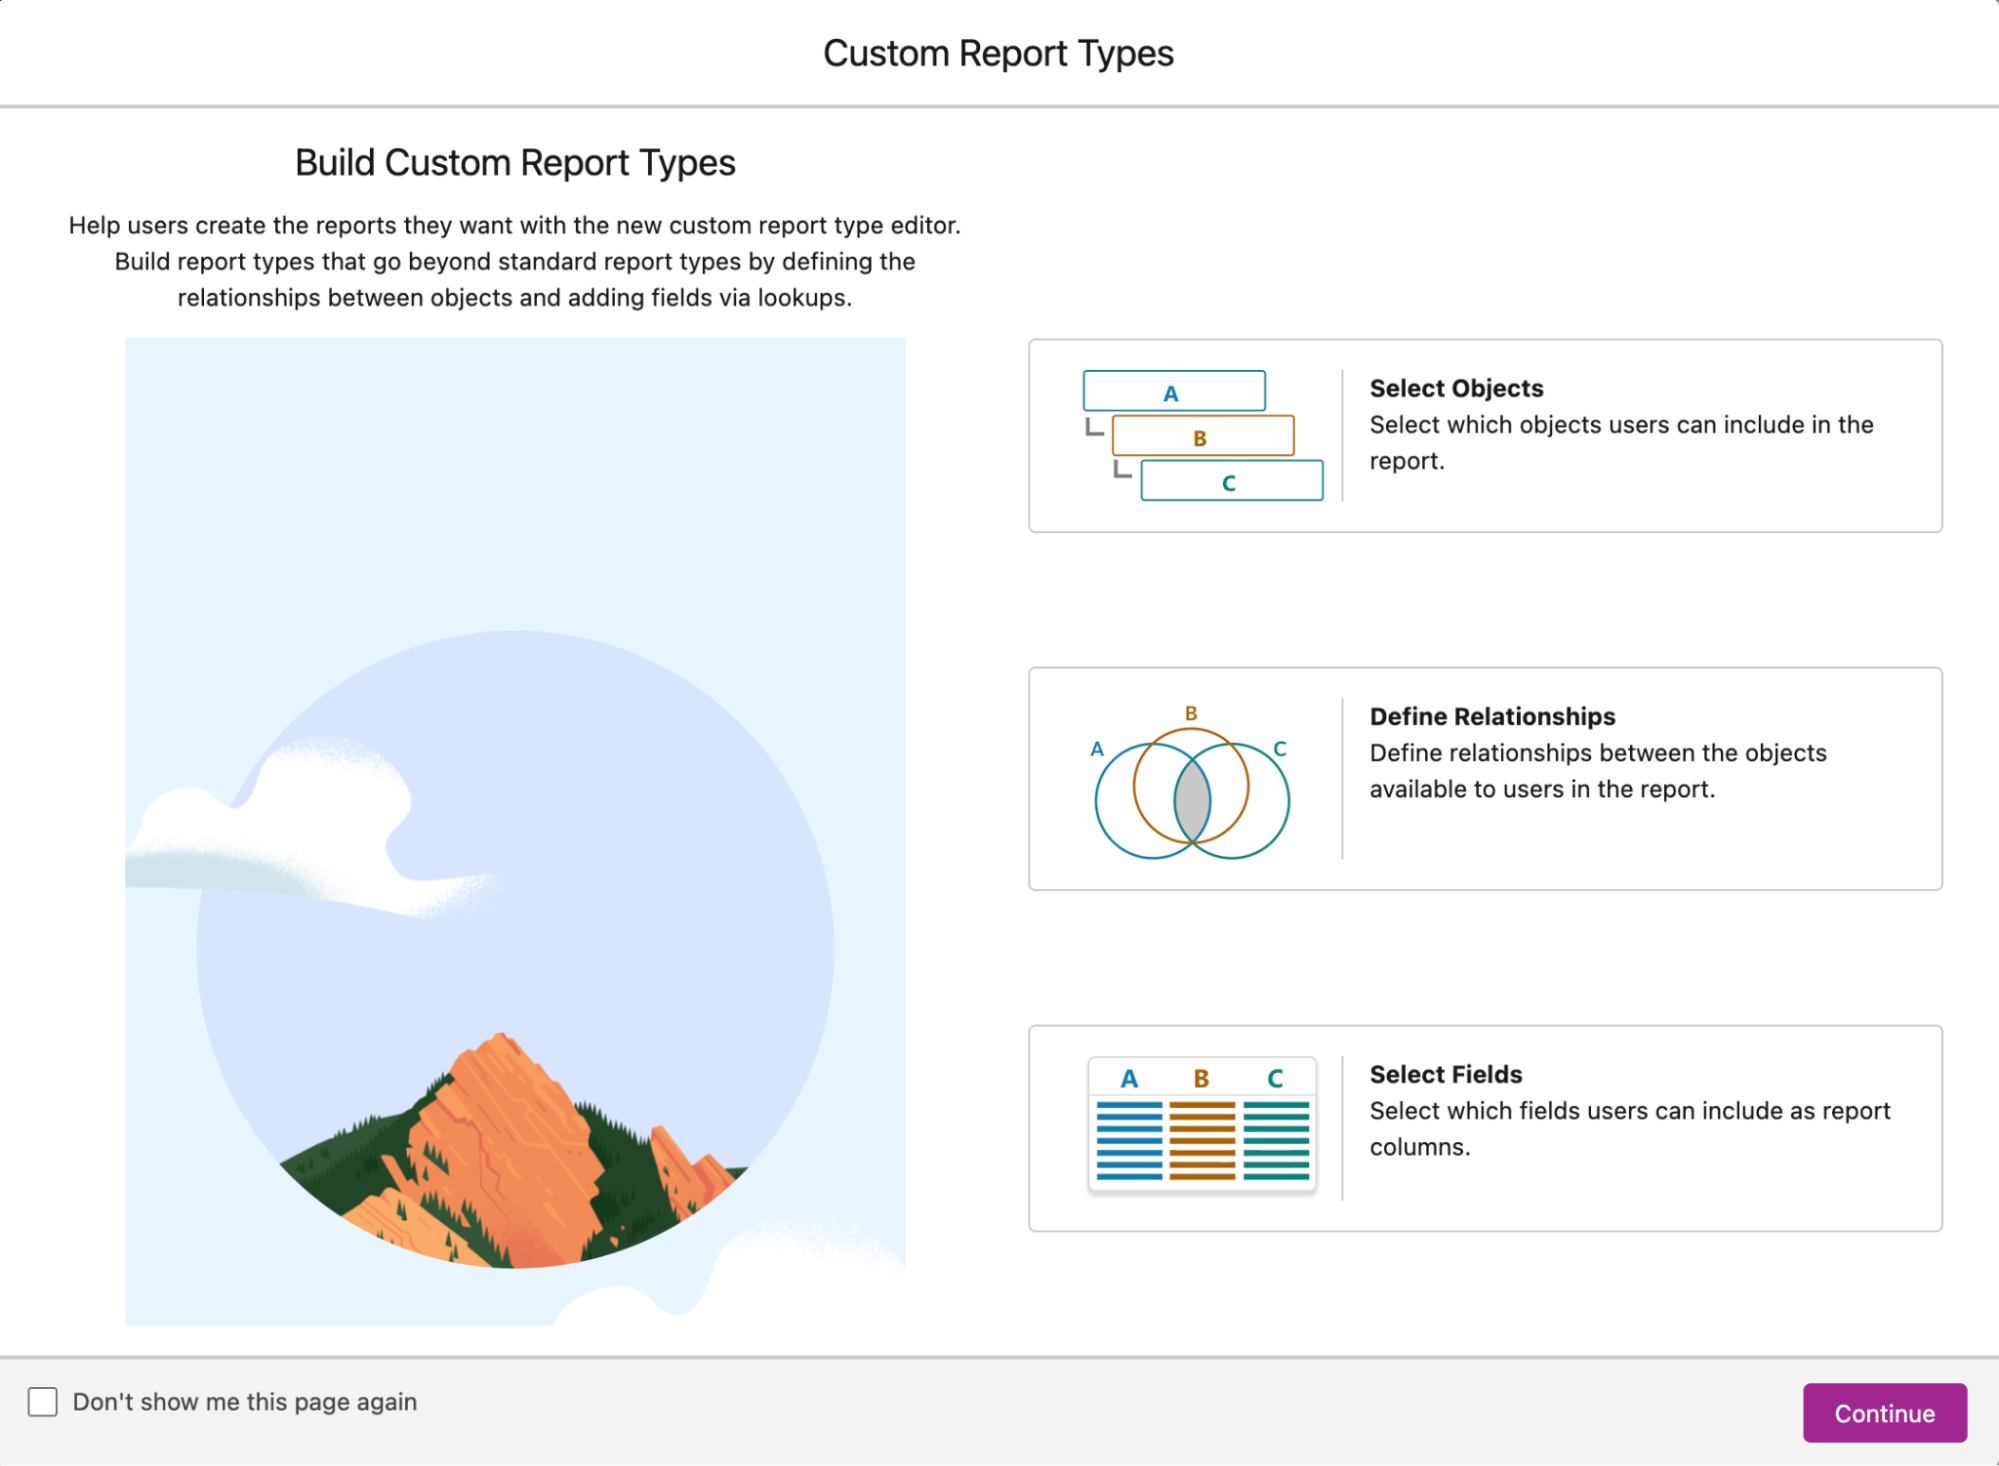
Ah, the final report format! Sometimes, none of the types mentioned above suit your needs. It’s a good thing that you can create your own combination of objects with custom report types. You can do this by simply going into Setup → Report Types.
You can check this article out for a more in-depth tutorial and examples on custom report types: Ultimate Guide to Creating Custom Report Types
Summary
At the end of the day, the best report format is the one that best answers the questions being asked (not the one you’re most comfortable building!). When in doubt, start with a tabular or summary report, then work your way up from there. Now go fix those reports!

Comments: