





Stop guessing which Salesforce objects and fields have data you can trust, with a native Salesforce solution that pinpoints which data quality efforts and trends to focus on next.
Highlights
- Scan your entire Salesforce org to uncover data inconsistencies across any standard or custom object fields.
- Configure analysis at the field level or analysis type level with customizable thresholds so results reflect your org’s needs.
- Run full configuration jobs for ongoing analytics or ad-hoc jobs for point-in-time snapshots.
- Forget about unknowns within your data through built-in observability mechanisms such as history, trends, and a built-in Data Quality score.
- Get actionable results in minutes with charts, tables, and percentages that show you exactly where your data quality efforts should be focused next.
In the era of AI, a company’s most powerful asset is data and the context it provides. Be it information about people or companies, sales, support, or marketing, and virtually everything else stored in your CRM. The question is, can you trust all of your data? Is there anything you should and would improve?
Answering these questions can rapidly turn into weeks or months of work and analysis, but that doesn’t have to be the case! With Plauti’s dedicated tools, you and your team can quickly obtain a clear picture of your data and underlying issues that prevent you from making the most out of it – just like an MRI scan, but for your entire Salesforce instance.
With 20+ analysis types to choose from, including fill rate and duplicate value analysis, realizing certain fields are not ready for AI or reporting can remain a thing of the past.
This in-depth overview will showcase the main Plauti monitoring features, ideal use cases, and setup effort, as well as how fast your team can (and will) adopt this new tool.
Features
Plauti’s functionality for all your data needs is shipped as a Salesforce-native managed package, and after installing it into your Salesforce org, you will notice that the entire functionality is condensed into one single Lightning App. This will be your go-to place to find out everything there is to know about the data within your Salesforce objects. Let’s dive in!
Object Configuration
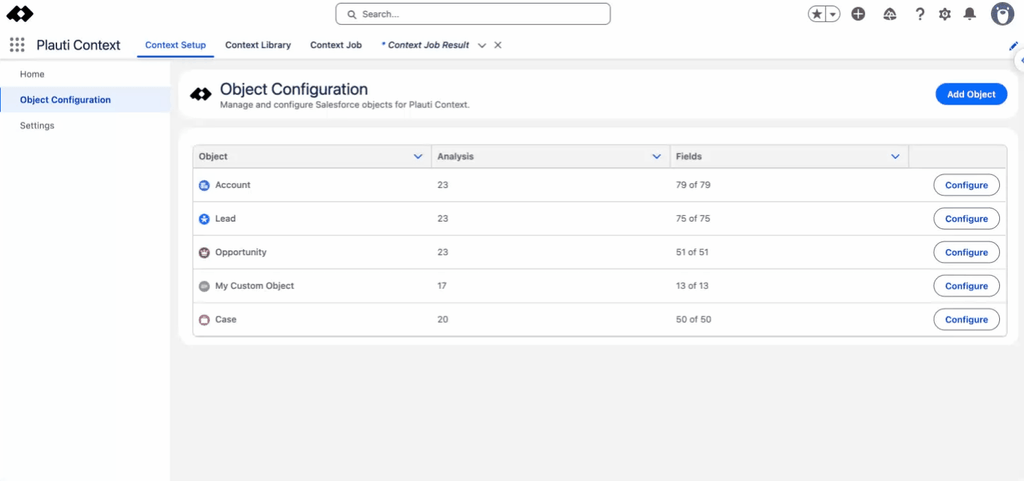
First things first, within the Setup tab, we need to go through the Object Configuration. This simply means adding the object(s) you would like to analyze. While starting, the recommendation is to add a few objects tied to your core processes – Account, Opportunity, Contact, or Case could be great examples. You can, however, choose to add any custom object as well, so it depends on where the key information you want to analyze is.


The object selected will quickly be added to the list and become available to configure further. Note that each of the object pages will have a “Refresh Metadata” button in the top right corner. This button should be used any time a new field is created, or an existing field is modified, for Plauti to have the most up-to-date information.
Analysis Types and Settings
With the objects added within the configuration, it’s time to decide how and what will be analyzed. When it comes to the analysis types this solution offers, you can either start from the field level or analysis type level. Either way, depending on the field type, there are over 20 to choose from. A few to choose from when starting are the following:
- Duplicate value rate: Flags fields that should be unique (e.g. mobile, email).
- Email domain analysis: Extracts the most frequently used domains within your database, making it easy to identify spam (e.g. @qq.com).
- Fill rate: Shows how populated key fields are, useful in preventing integration issues or uncovering fields unsuitable for reporting or AI.
- Inactive picklist usage: Identifies records still using deprecated values that can break automations, reporting, or integrations.
- Active picklist value distribution: Surfaces unused active values that are cluttering the user experience or processes.
- Value distribution: Shows inconsistent entries (e.g. “Germany”, “DE”, “Deutschland” in the same country field) that can break core processes, for example, if they are part of shipping addresses.
- Format pattern detection: Identifies format inconsistencies in phone numbers, postal codes, and product/invoice numbers.
- Future date analysis: Flags date fields with impossible future values (e.g. birth dates).
Keep in mind that some of the analysis types, respectively, value distribution, format pattern detection, and email domain analysis, may hit Salesforce governor limits if used on too many fields at once. This can be prevented by selecting a few key fields when making use of these.
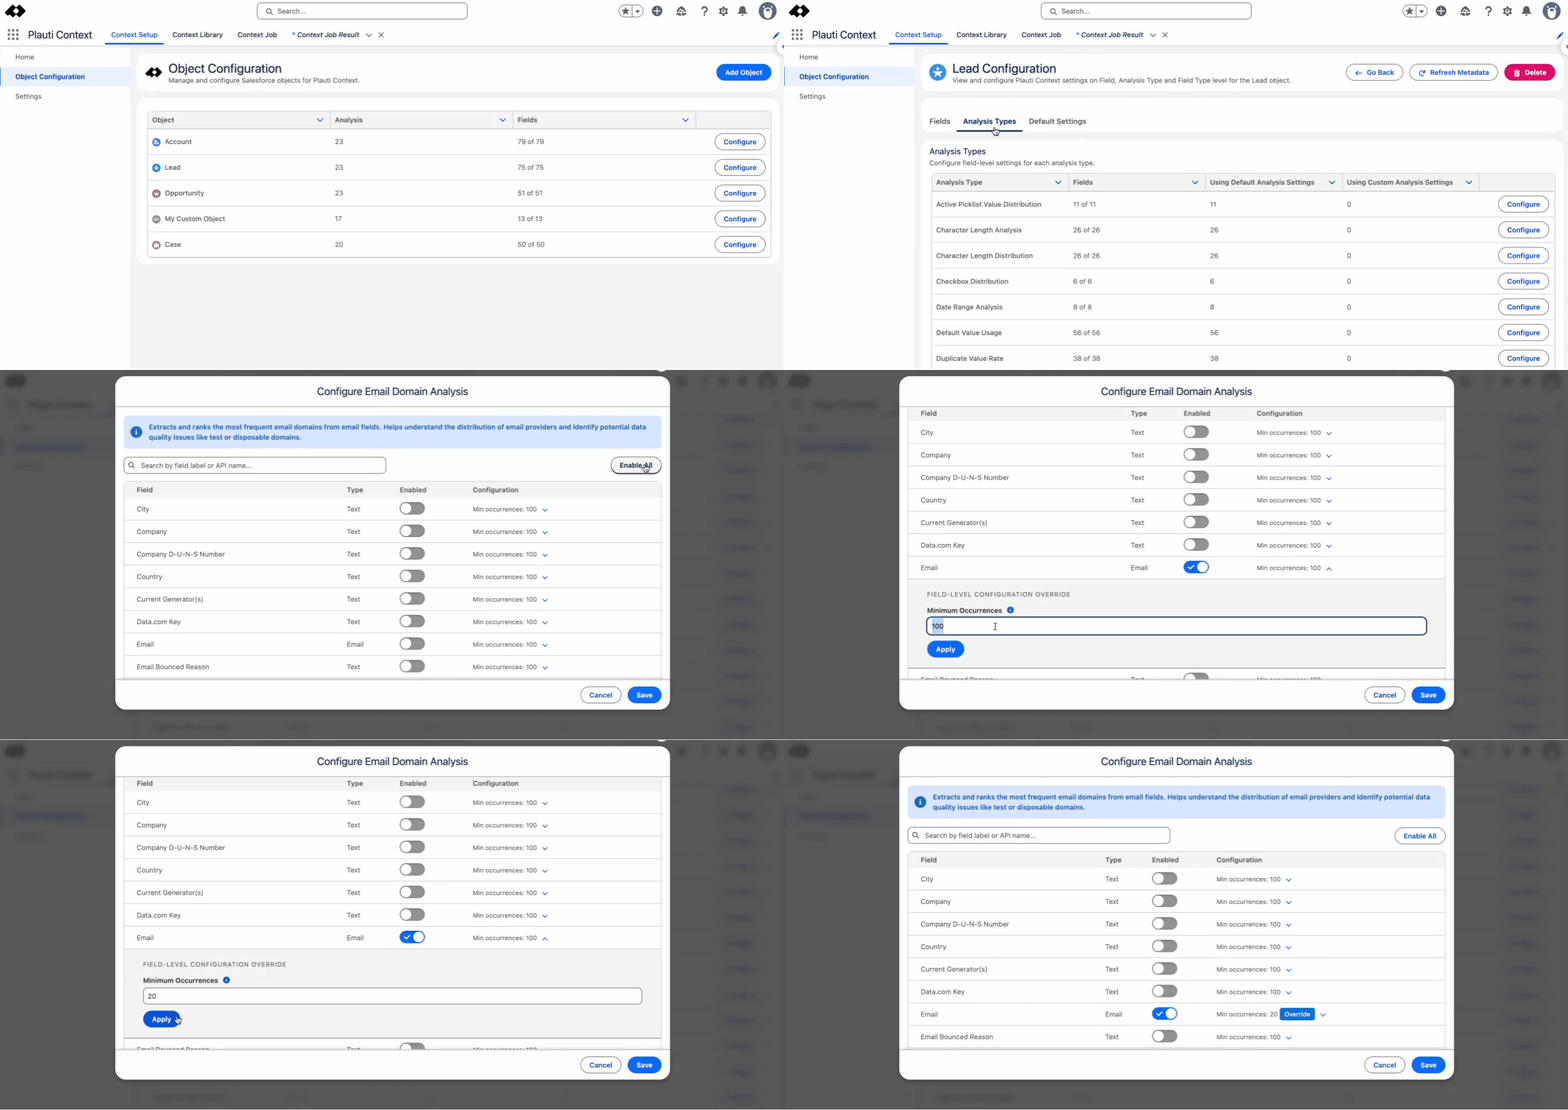
Additionally, note that most analysis types can be configured per your company’s needs. In the example of email domain analysis, the configurable aspect is the number of occurrences to be considered. For other analysis types, as you will see below, the configuration is color-based and percent-dependent.
When starting from the analysis type level, however, keep in mind that you can pick and choose every single field to which this will be applied. So, in the case of email domain analysis, I disabled all other fields and only kept Email.
Field by Field Configuration
While the example above had the analysis type as the starting point, we can go the other way around – this is especially useful if there are only a few key fields you want to focus on within an object.
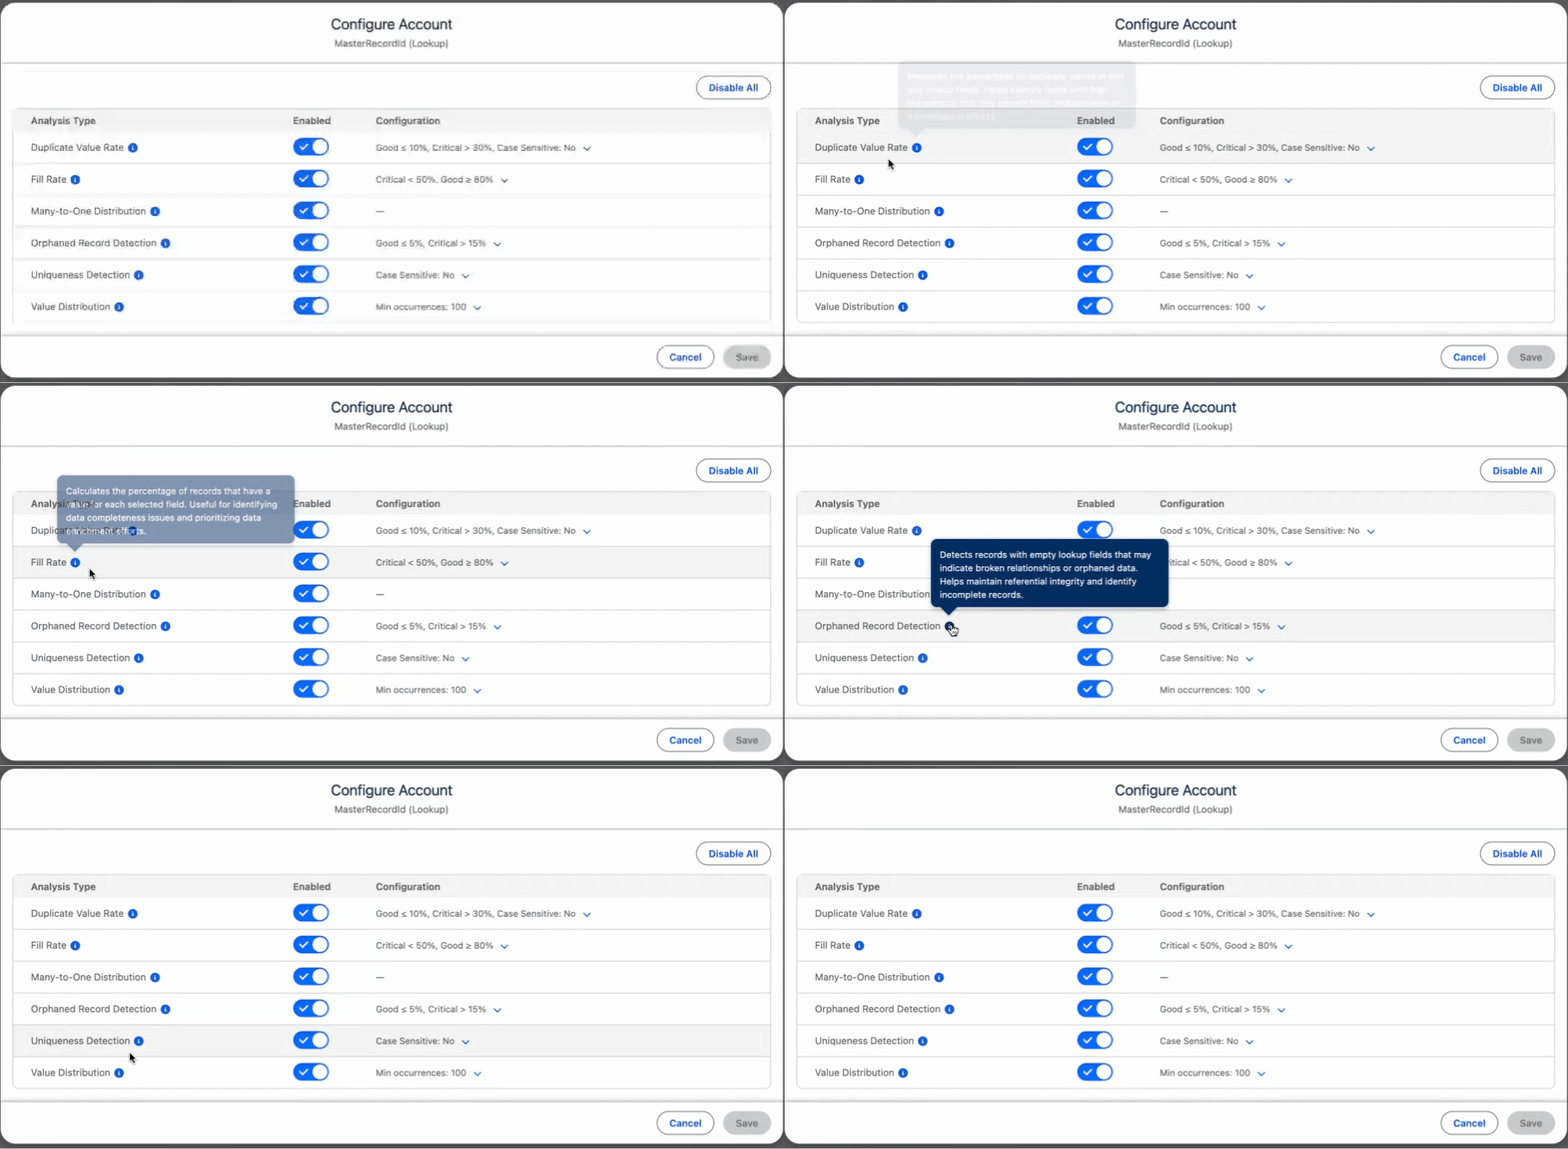
Based on the field type, each field will only have the analysis type(s) suitable for it in a list. For each of them, you can hover over the information bubble to find out exactly what they are meant for before deciding.
Plauti Jobs
Finally, once the object configuration is fully done, it’s time to run the actual jobs. From the get-go, keep in mind that job completion time varies based on the number of records, fields, and analyses configured.
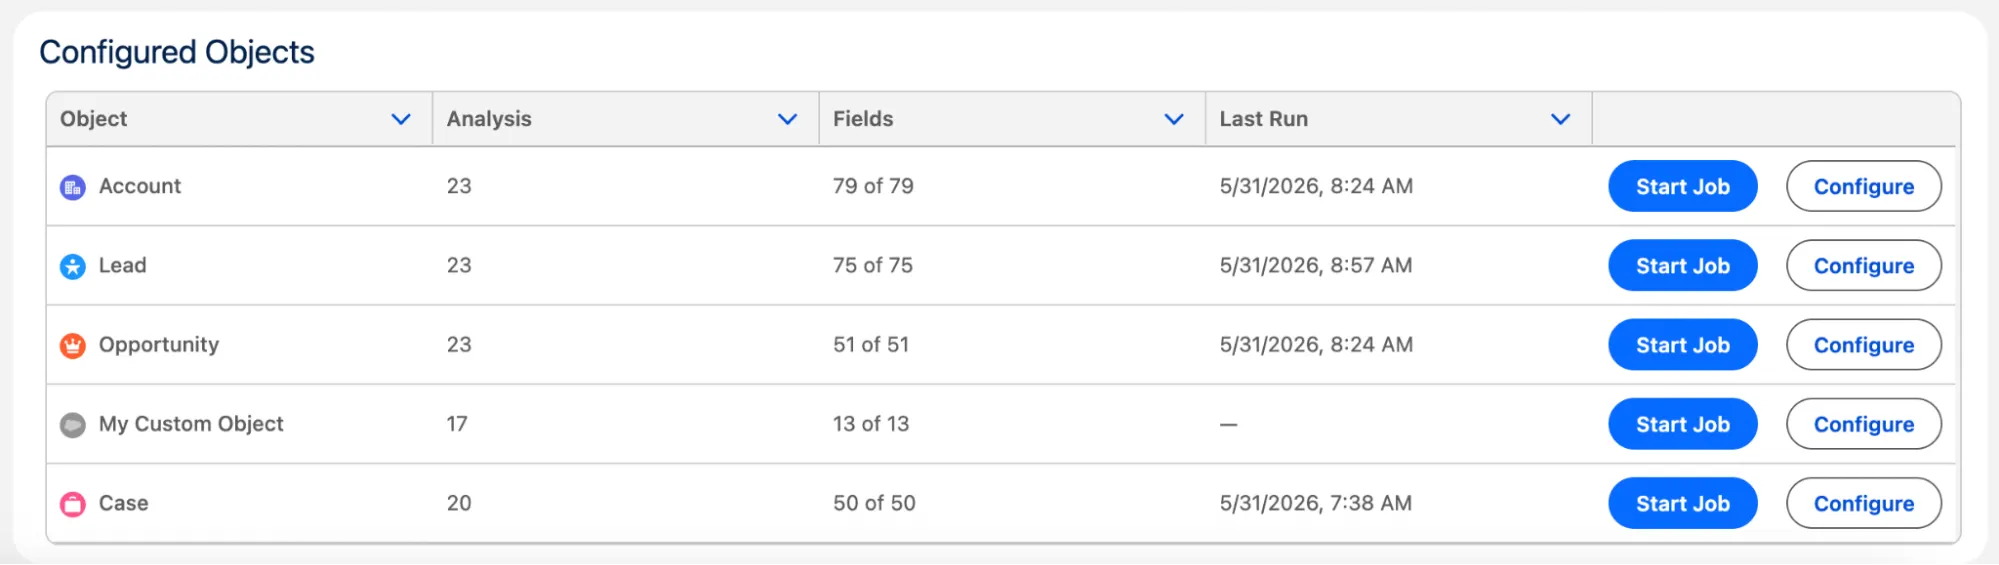
The objects list will always be displayed within the Setup home, and this is where you can easily start a Job from. This job runs in full across the entire object and fields, with the results used for analytics later on.
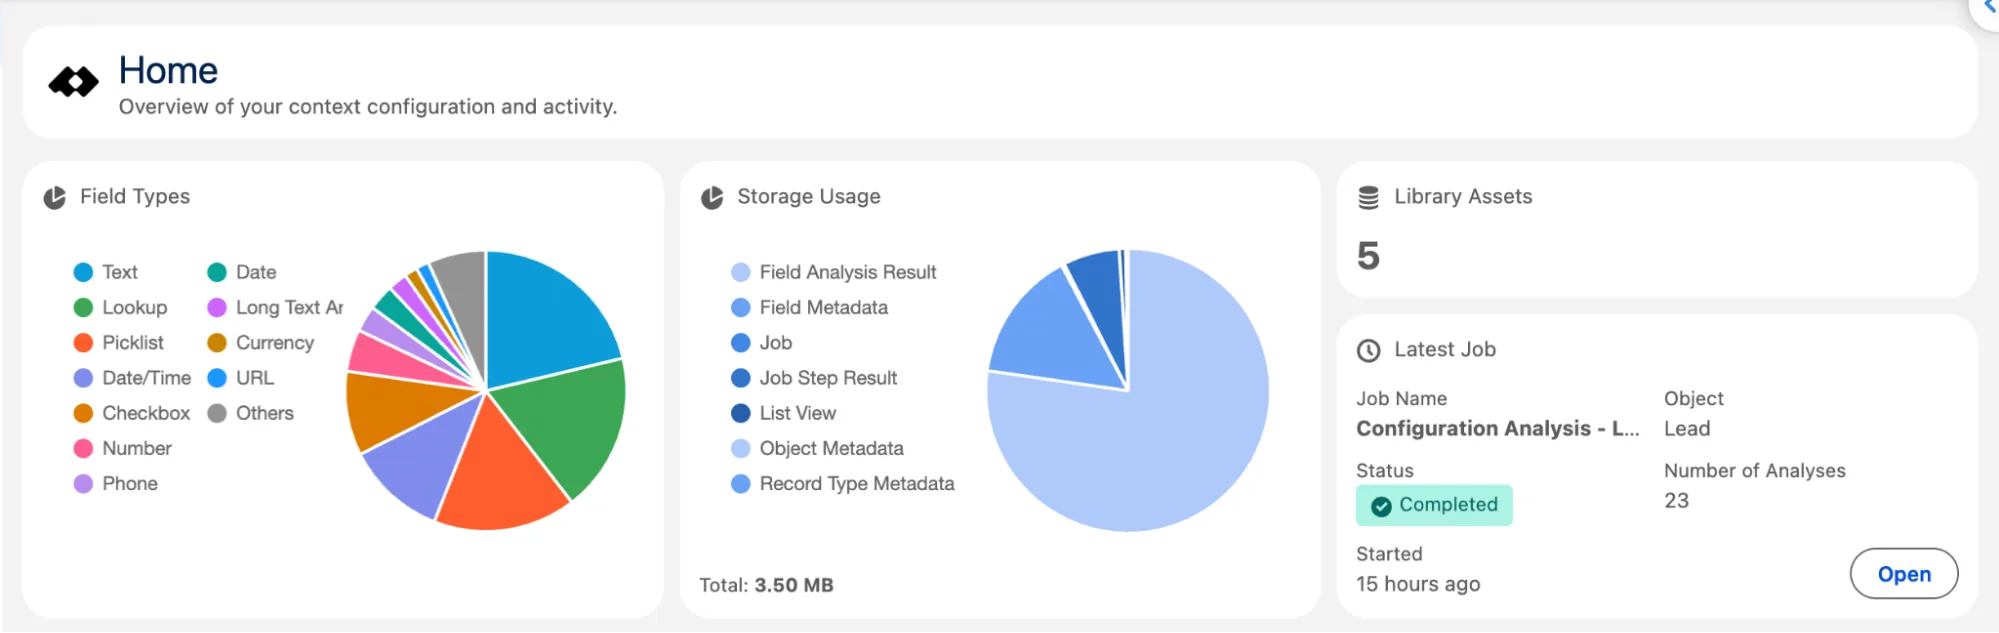
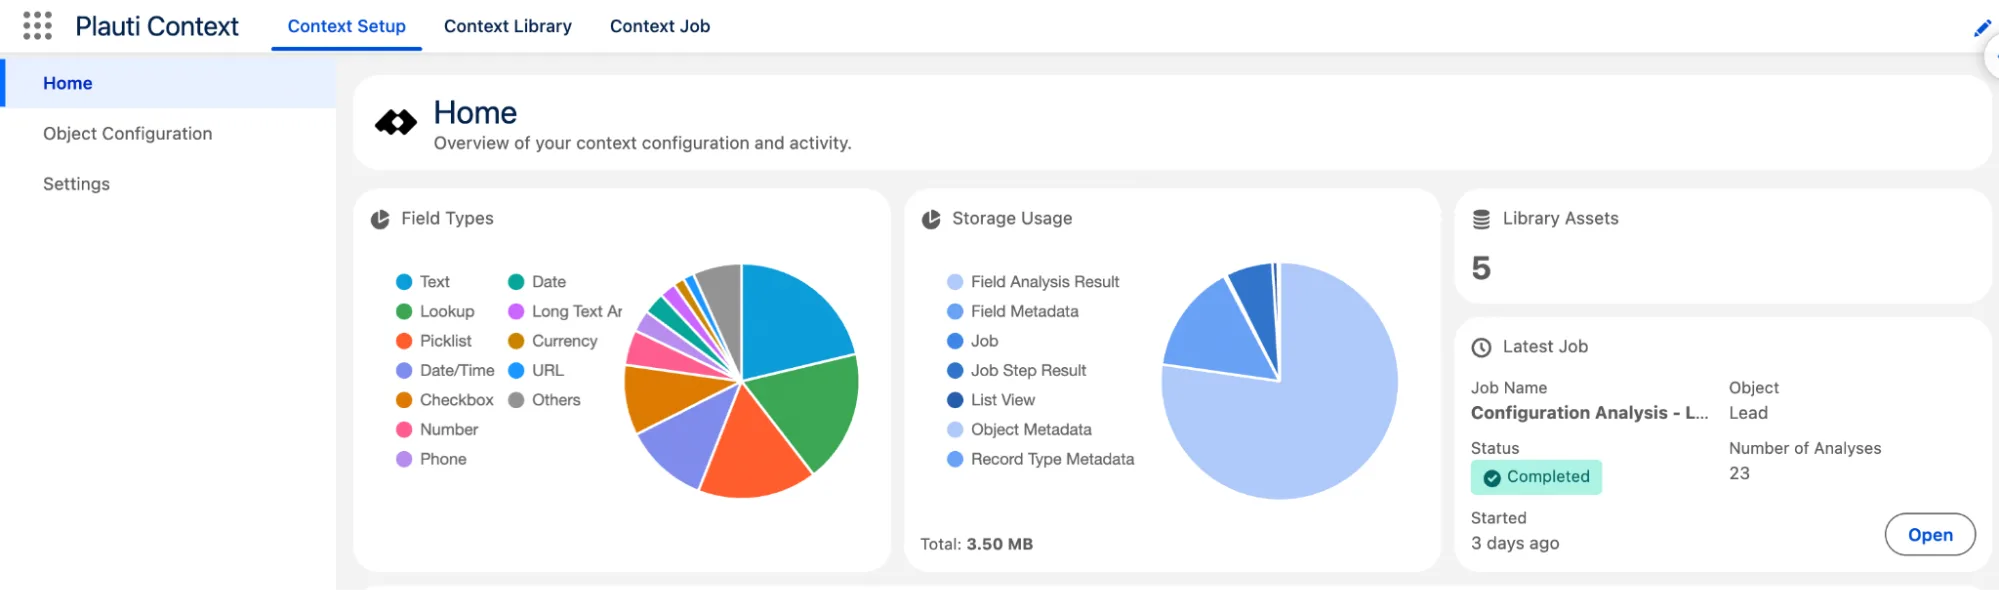
The latest job information will also be displayed on the same page, whether queued, in progress, or completed, as the Lead one below, which was completed for 23 analysis types.
Job Scheduling
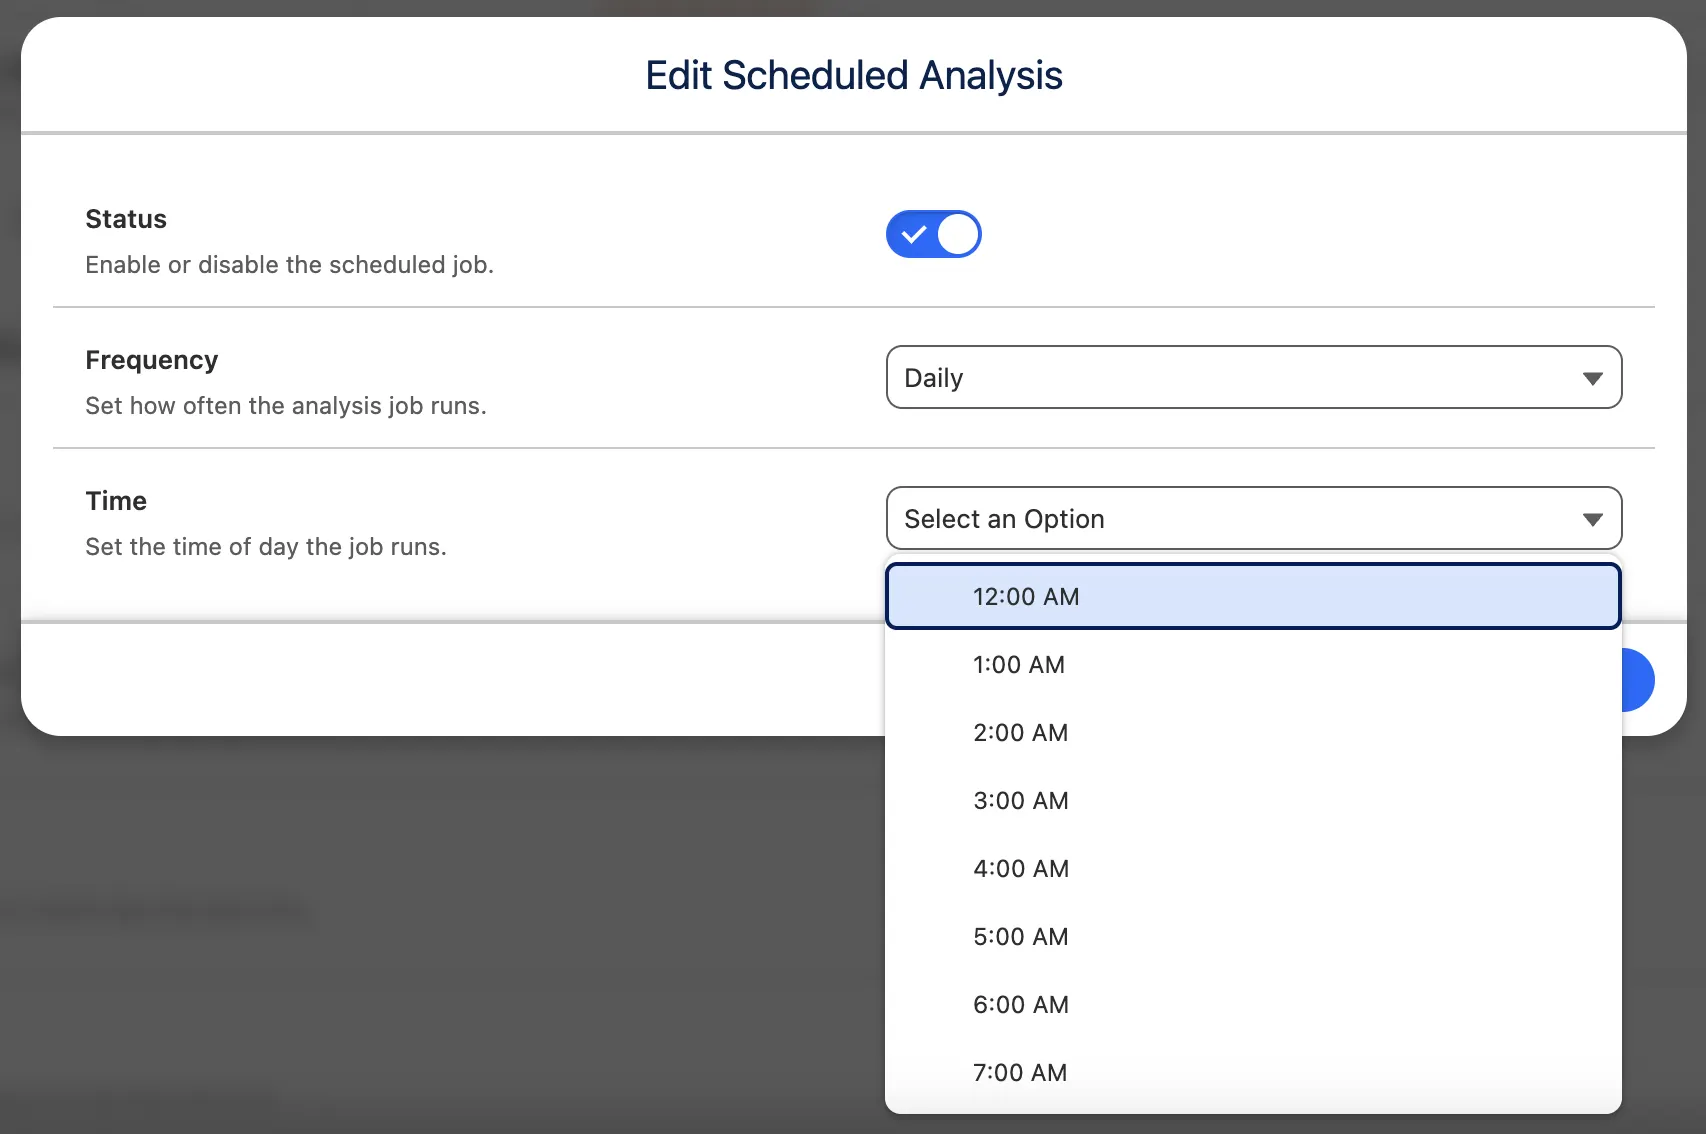
For each object, the analysis can also be scheduled within the configuration. Everything that has been configured can be run either daily, weekly, or monthly. You can also select the time, day of the week, or date of the month depending on your preference.
Ad Hoc Jobs
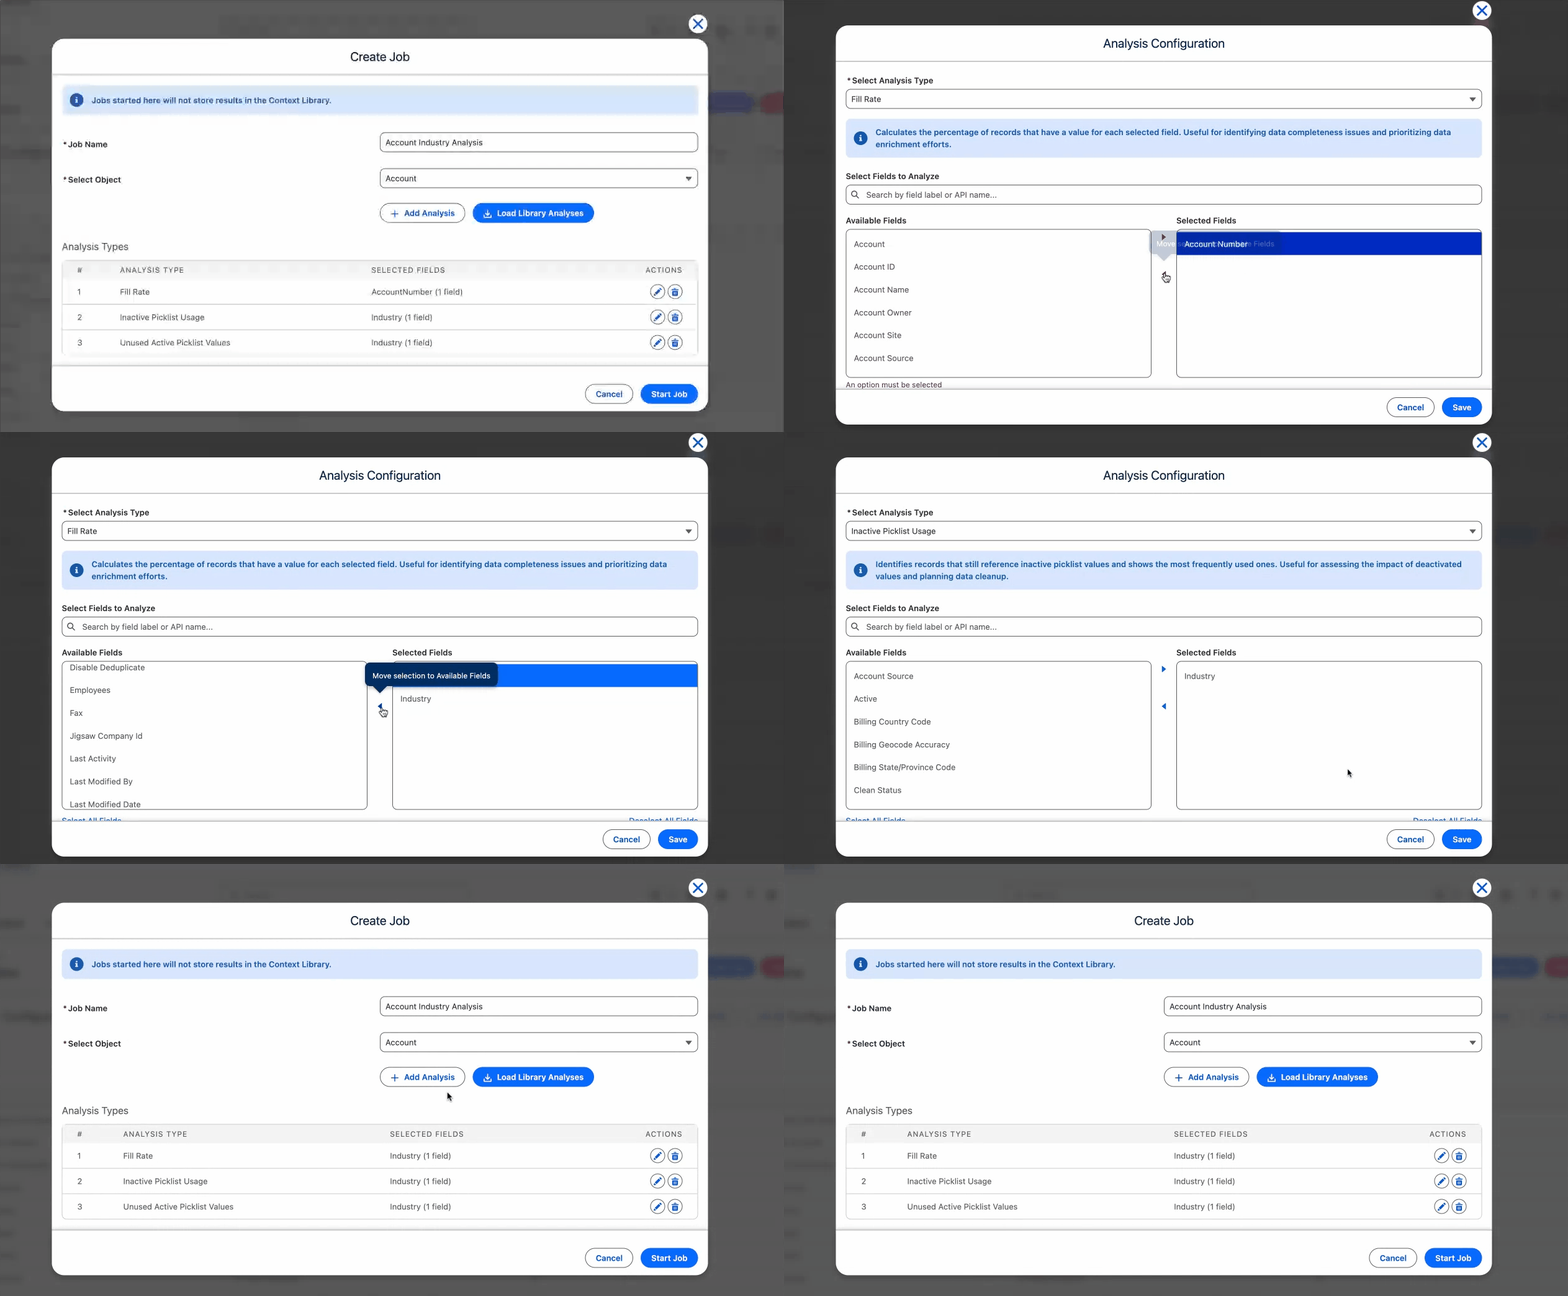
There will be times when a full job run doesn’t make sense, especially if you’re interested in a point-in-time snapshot of your data. This is where ad hoc jobs come into play.
You can create one at any point, right from the Jobs tab. When creating a new job, you can select one object at a time, but pick and choose however many configurations you’d like. Within this screen, you can’t make configuration changes, so whatever you already selected within the object configuration, that is what will be applied in terms of settings.
Unlike the full object job, these results will be available, but not saved for analytics.
Job Results
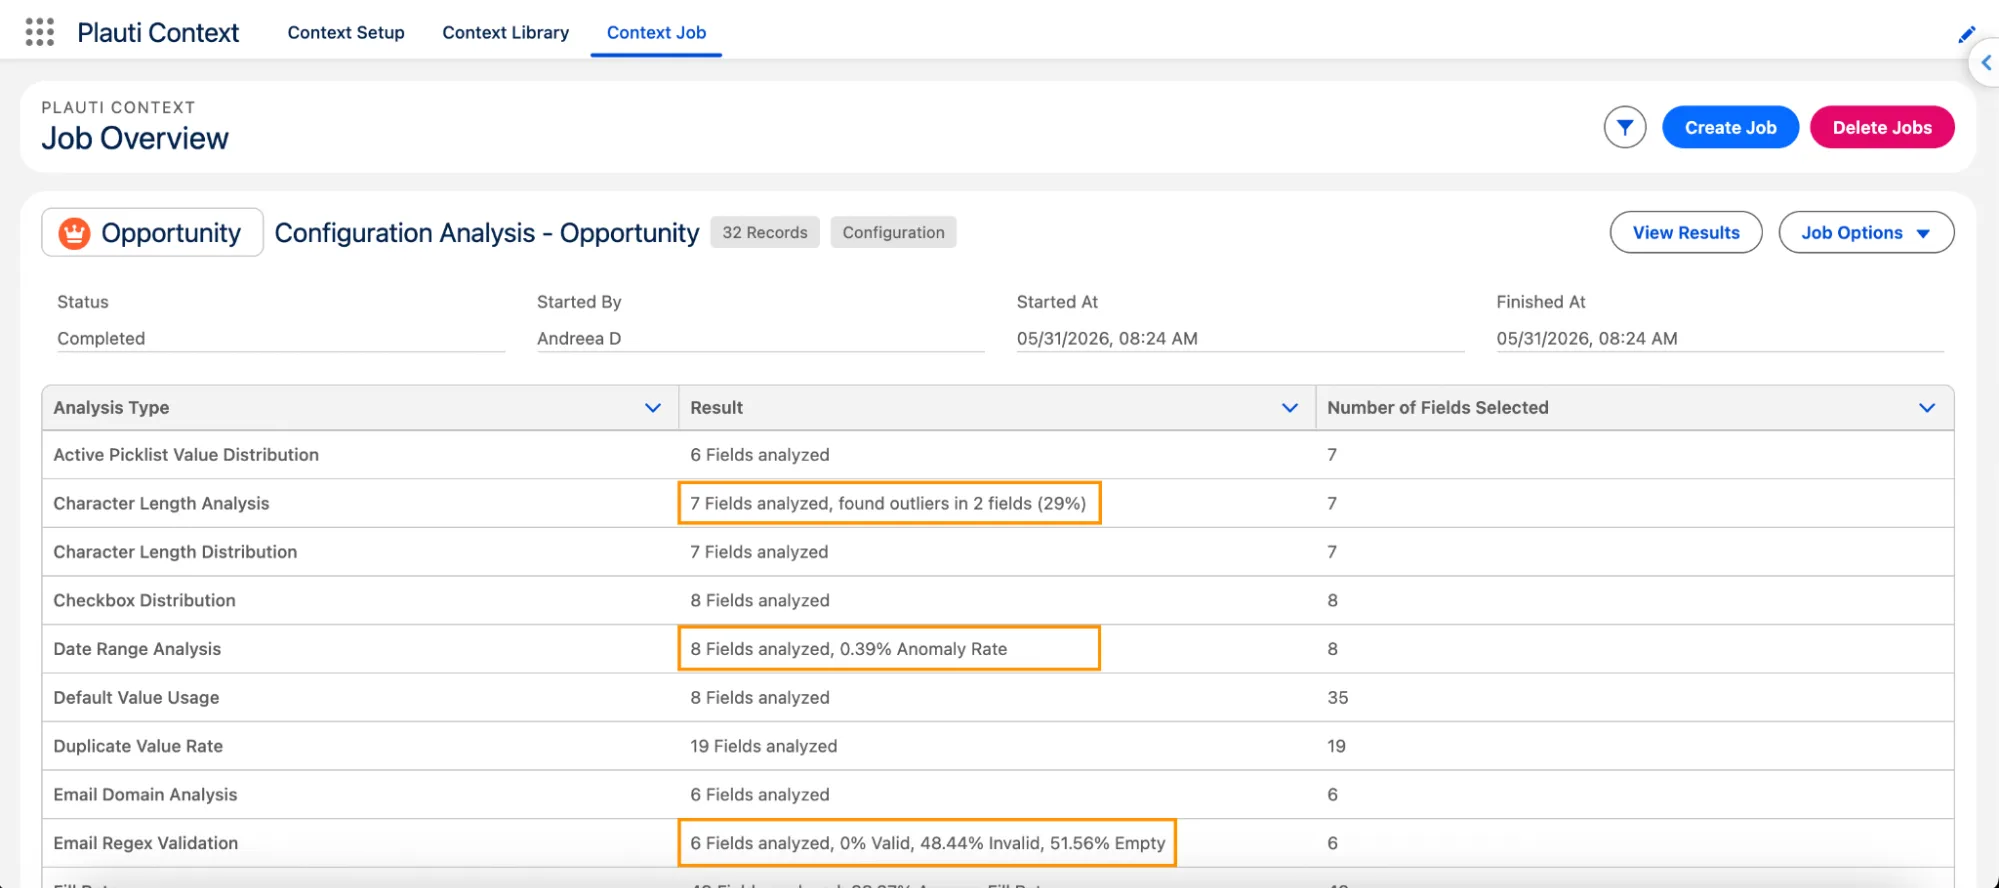
Of course, once you run the jobs, it’s time to dive into the results! Notice that each job within the list from the Job tab will have certain tags – the number of records, as well as the type of job.
Without actually clicking into the results, you already get a high-level overview of the insights. For example, following the Opportunity analysis within my Developer Edition org, the anomaly rates, outliers, and email validity were already identified – all this in less than a minute, but only for the 32 records available.
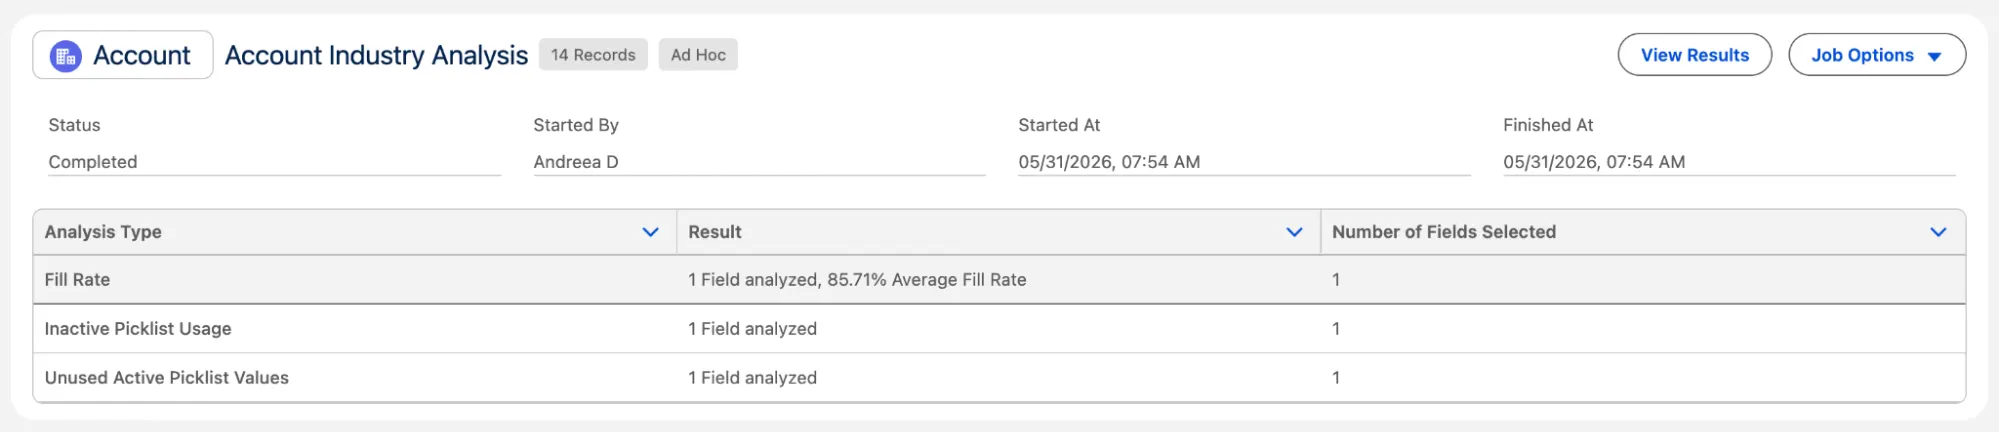
On the same page, you can also see the ad-hoc jobs as well, and once again, the result preview will be as insightful. For any of the job types, you can click further to view the results.
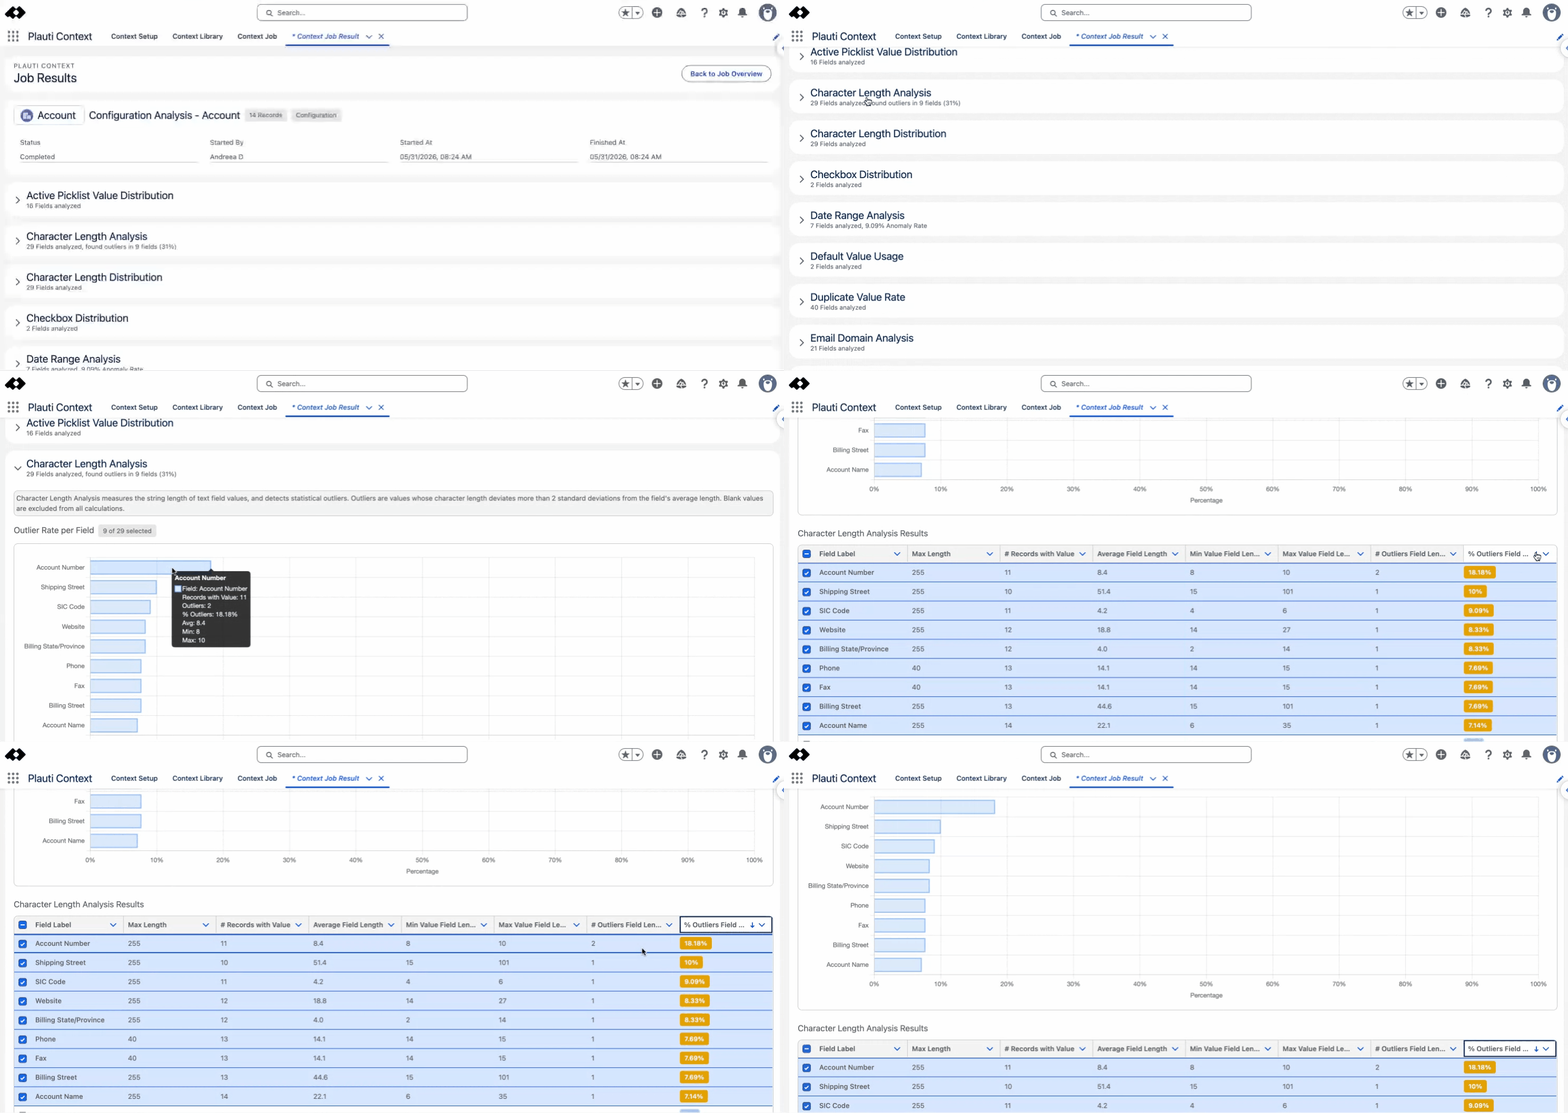
When doing so, you will be met with a comprehensive list of every analysis type that was run. Depending on the analysis type, there will be a chart (bar or pie) available, as well as a table with the percentages when warranted.
For example, this Account job was run with all default settings, and I clicked into the character length analysis – hovering over the bar chart provides field-by-field insights too, but they are much easier to review in the table below as the percentage is also highlighted and can be sorted as needed.
Analytics and Statistics
One thing you will notice immediately is the Home page within the Setup tab – once at least one object configuration is added, both the Field Types and Storage usage will become available. This is just an at-a-glance insight to help you keep an eye on everything that’s going on across your org, and within your objects.
For even more details, the Library tab is where you want to go. The Field Types chart will be available for each object individually, alongside the object metadata details. Additionally, this is where the saved job results matter to provide immediate insights.
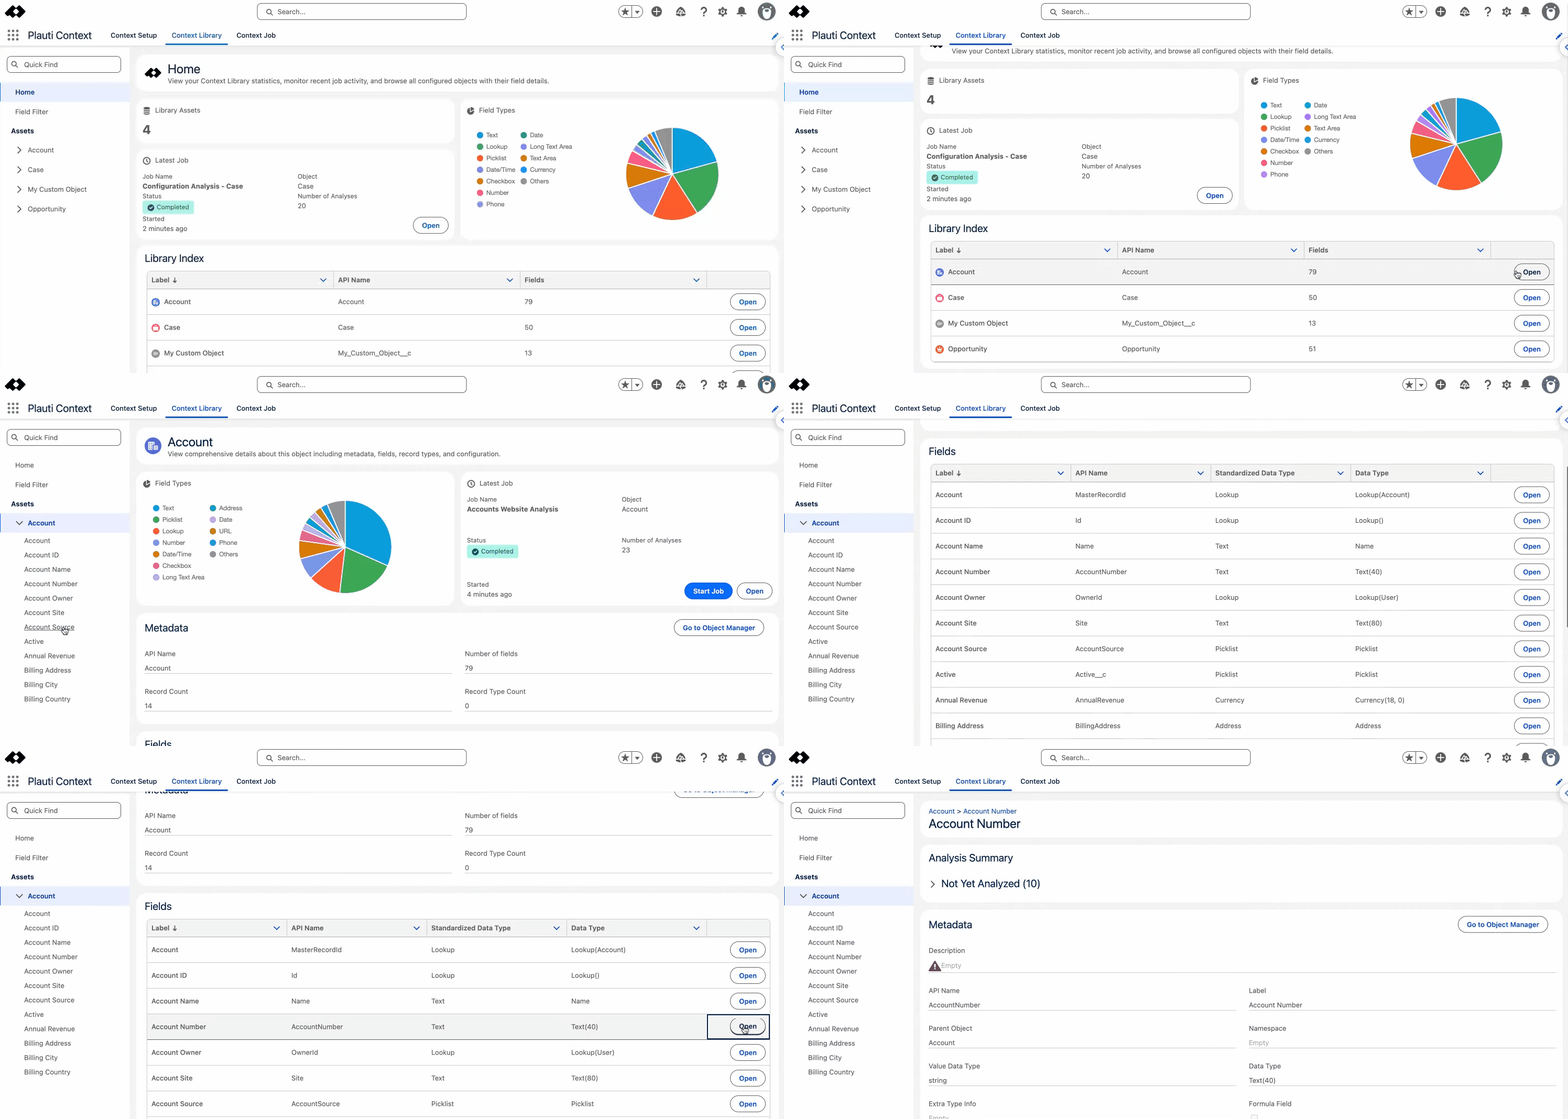
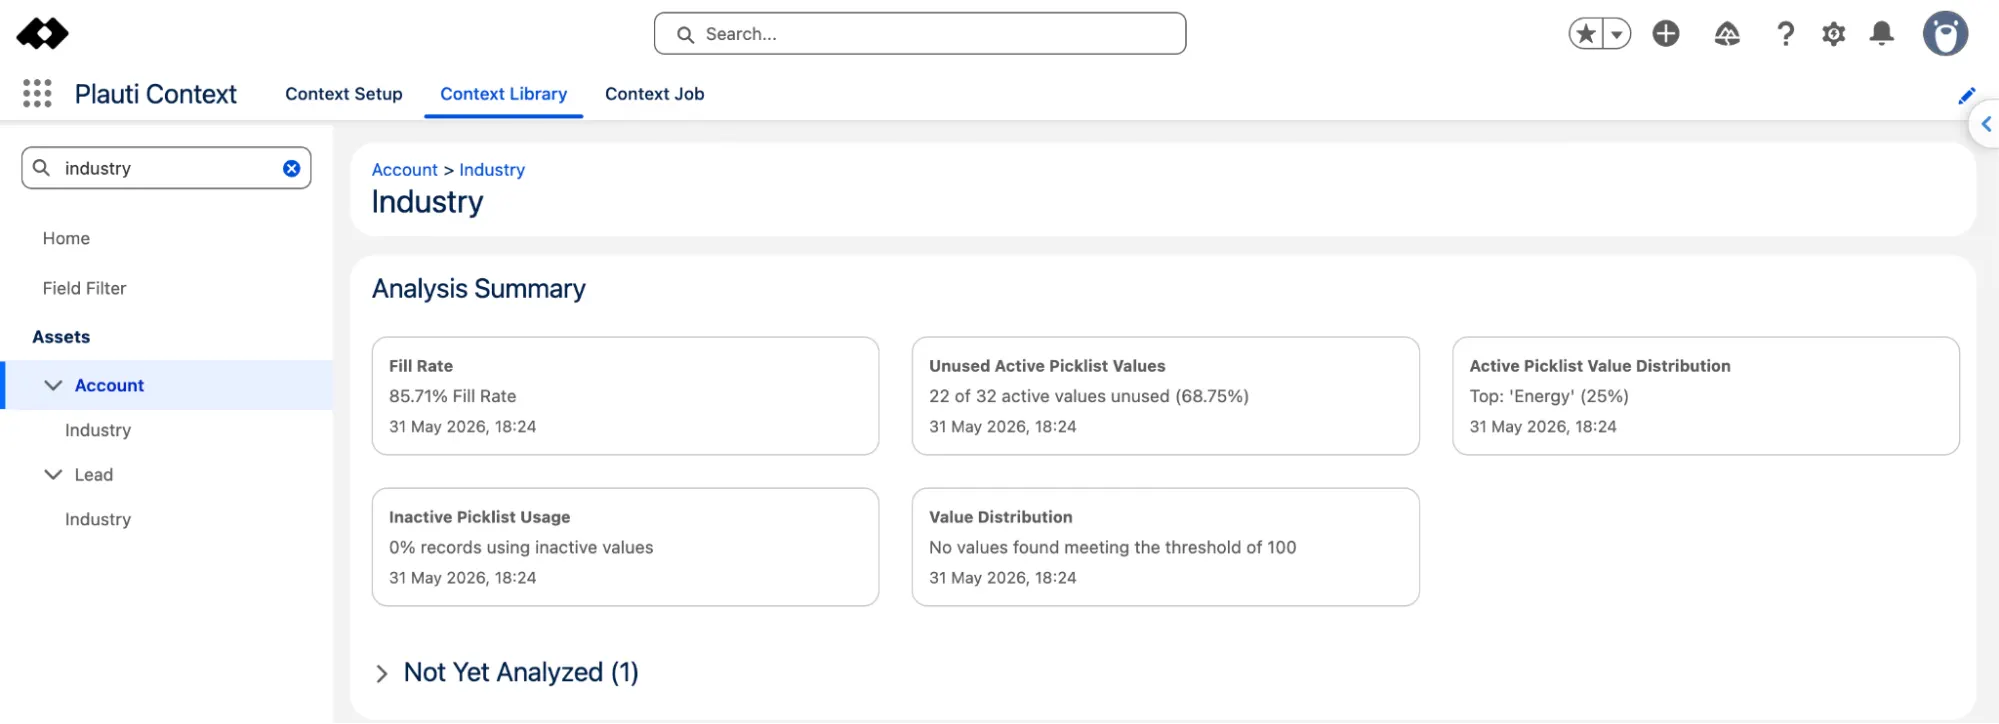
After an object-level job has been run, the latest field insights will be displayed as well. The Analysis Summary will display the results from the latest job for each analysis type the field was included in – as you might have noticed in the GIF above, the “Not Yet Analyzed” section initially includes all available types a field can be checked against.
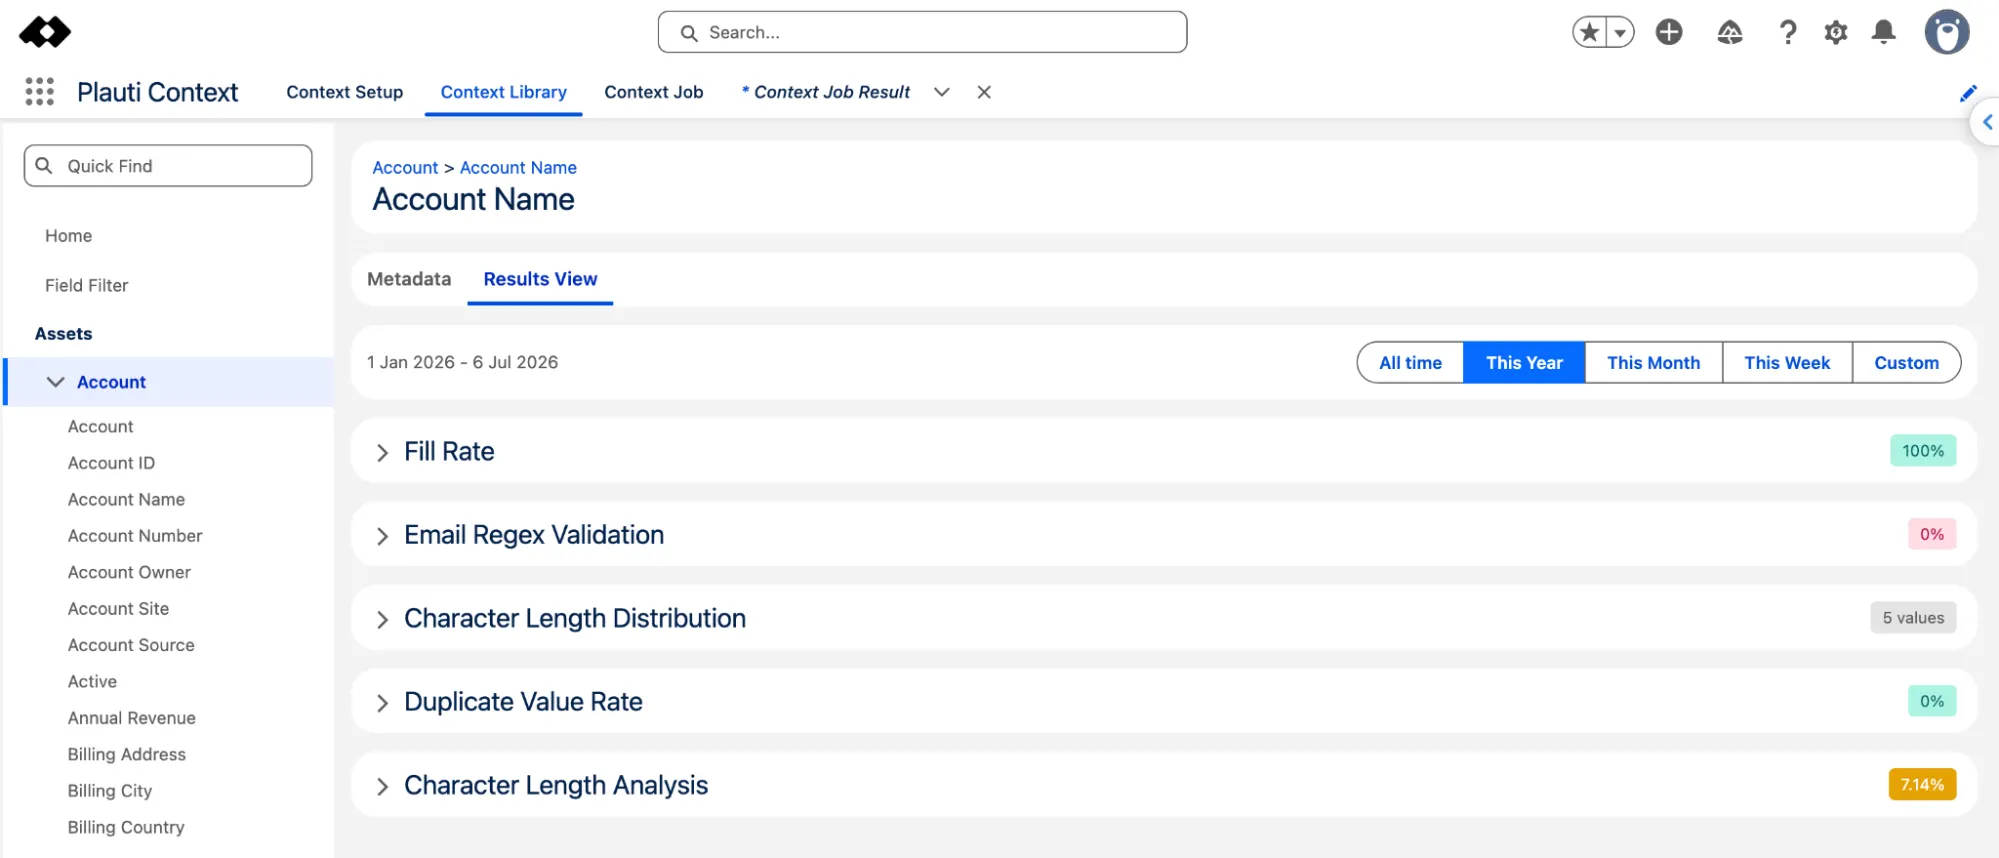
Furthermore, for each field included in one or more of the jobs, you and your team can track changes over time. This way, you can ensure improvements are happening across the board, while keeping an eye out for any outlier results.
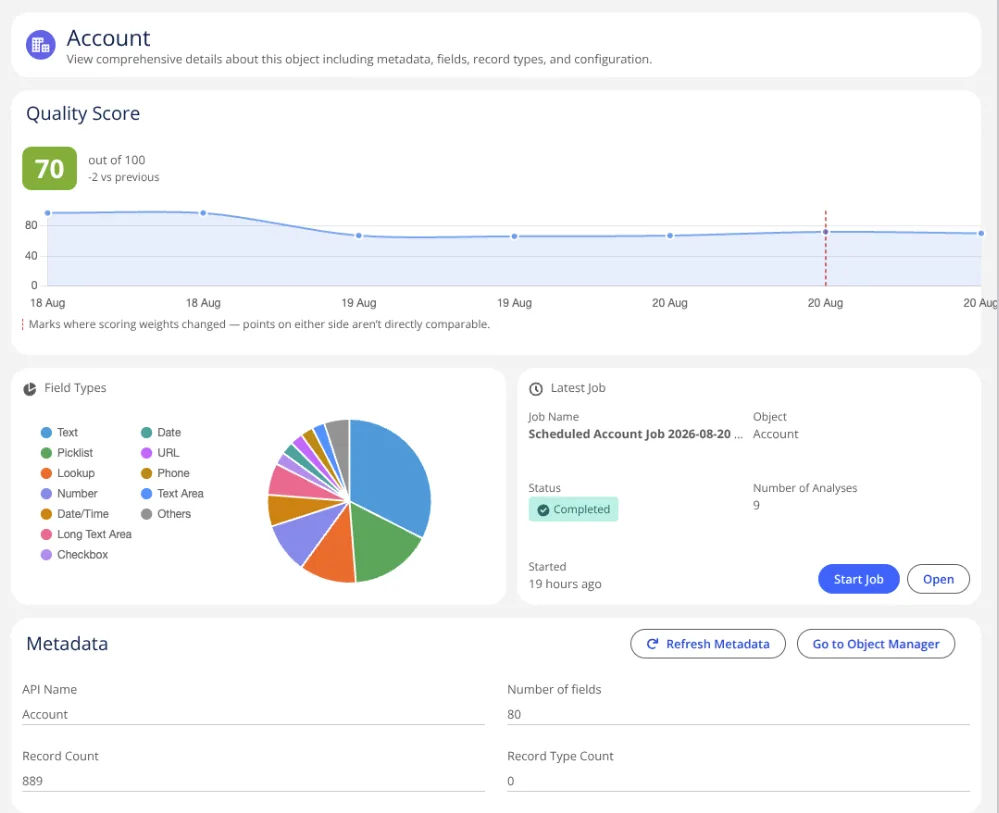
The newest addition is the Data Quality Score. Every time a scheduled analysis runs, Plauti scores your data from 1 to 100 at object, field, and record level, so you can see how healthy your data is and where to start fixing it.
Use it to diagnose your data at the start of your data quality journey, then keep using it to monitor progress. The Data Quality Score can also be reviewed in a plain, non-technical PDF summary generated after each analysis job to explain overall data quality and recommended actions.
Trend charts show how each score changes over time, so your team can see its cleanup work paying off and keep momentum.
Roadmap
On top of what is already available within Plauti’s current offering, the team is planning to add, as part of their upcoming releases, even more features you and your team can make use of:
- Continuous monitoring: Understanding your data and knowing whether it’s ready to support automation and AI. You will have the ability to track data quality over time, quantify it at every level, and get a straight answer on whether it’s in good enough shape to build on.
- Trend Analysis: Store the results of Scheduled Analysis and see how your data quality initiatives evolve.
- Health Check Report: The results of an analysis job that tells the data quality of the object and the status of your data.
- Alerts: Be notified when something drops under the threshold you set.
Use Cases
Given the number of analysis types (which will only continue to increase over time), it should come as no surprise that Plauti can be leveraged across the entire team, from day one.
Perhaps one of the most straightforward scenarios that every Salesforce Admin has encountered is the fill rate for either standard or custom fields. Not only can you obtain the fill rate value as well as the average per object with ease, but you can also override the configuration to tailor it for your org. For example, if you expect the fill rate for a field to be 100%, then that’s exactly what you can surface in the job results.
For a more complex use case, keep in mind that Plauti’s dedicated functionalities don’t work in a silo – the entire Plauti ecosystem of products is designed for an end-to-end cohesive experience, all while ensuring your data is up to par for all of your team’s needs. This way, you can not only understand, but also continuously monitor and fix your data health, and get it AI-ready.
Salesforce’s native email validation is less than ideal, as it doesn’t do much more than check if an address contains a prefix, @ symbol, and domain. Relying only on this check ensures that a high number of potentially malformed addresses slip through undetected, quietly inflating your future verification costs and lowering email deliverability.
Plauti closes that gap, as it runs a proper regex check across every email field and flags each value as syntactically valid or invalid, with counts and percentages per field so you can see the true scale of the problem in a matter of minutes.
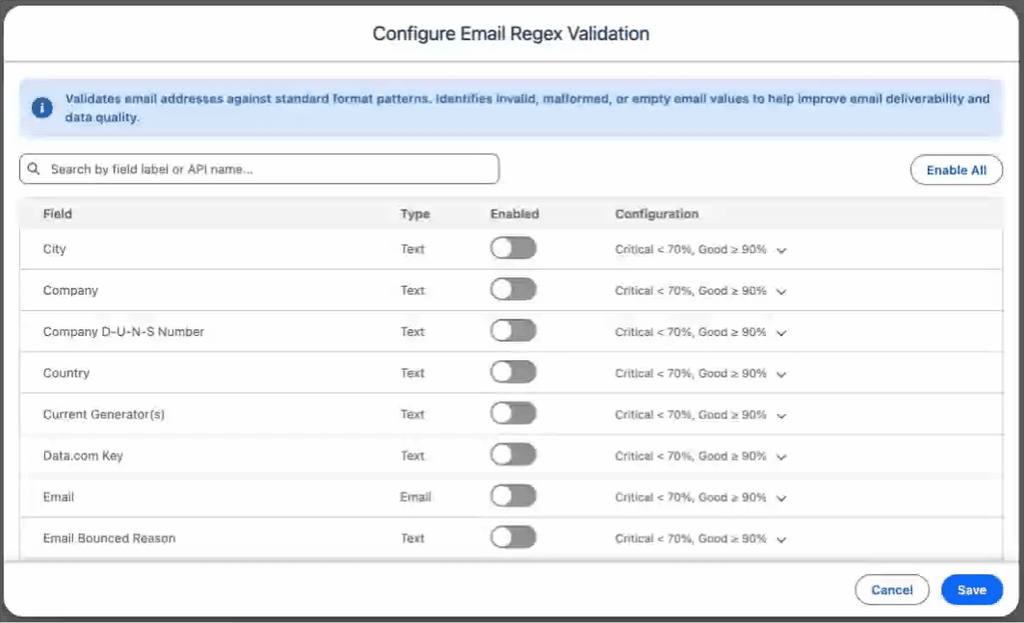
Optionally, Plauti can also help you act on the findings, especially when it comes to cleaning up placeholder or test values. For the email example in particular, you can quickly run a find and replace for “gmial,” which is supposed to be “gmail”.
Finally, Plauti can conduct mailbox-level verification, confirming if the email address actually exists and is valid. This step can be done one-by-one in real time by the team, or automated jobs can be set up as well. You can find out more about how Plauti can help with email, phone number, and address validation here.
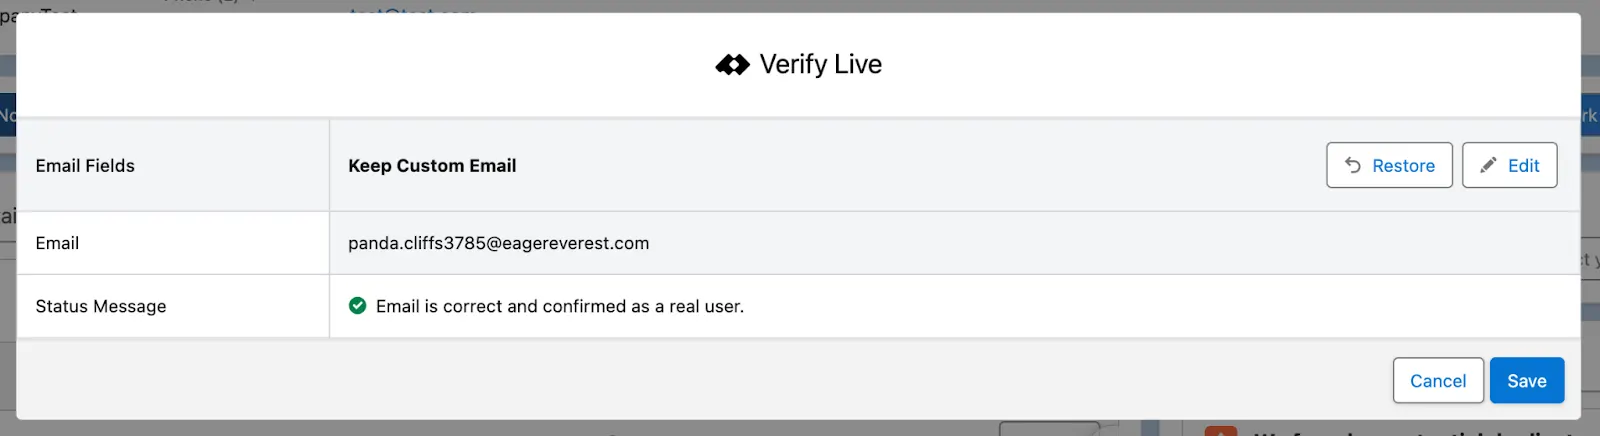
The overall result of taking these steps for your database is a smaller, cleaner candidate set, which leads to lower verification spend, and an email field your team can finally trust for outreach campaigns.
Another use case to keep in mind is deduplication. While there are a high number of angles for how duplicate records can be found or reviewed, Plauti’s deduplication solution can also come into play to ensure that the entire process is optimized and working as needed. One way to do this is to ensure that matching isn’t done on empty fields:
- Fill Rate analysis type can be run on the fields you’re planning to use for deduplication.
- Based on the results, you can assess if the fields are ready to be used or if enrichment is potentially needed.
- Plauti’s deduplication solution can then step in to properly identify duplicate records in no time, on reliable data.
Setup
Getting started with Plauti is not only easy, but also a customizable experience – it all depends on the number of fields and the number of records you will choose to analyze from the get-go.
Following the installation of the managed package from AgentExchange, two dedicated permission sets will become available: an Admin one and an End User one. Following the permission set assignments to your users, it all depends on your team’s choices:
- Which objects should be added to the configuration?
- Which analysis types are most suitable for the chosen object(s)?
- Are there any customizations to be done for the analysis types, or would you keep the default settings to begin with?
These are just a few of the questions you might ask at the beginning, but regardless of the starting point, the insights will be uncovered much quicker than reports or queries would surface them, with just a few clicks from a Salesforce Admin or Data Steward. Either way, each of the analysis types is explained as you’ve seen earlier in the article, so you can easily choose which is suitable for each object and field.
While the setup is straightforward, if you have any questions particular to your implementation, the Plauti team is always ready to help at support@plauti.com.
Pricing
Plauti’s solution for data quality assessment and monitoring can be accessed for free by all Salesforce customers, with no dependency on other Plauti products, for point-in-time analysis and through a trial including all premium features.
Find the right health visibility and automation level for you – start free, or unlock higher usage, monitoring, history, trends, and more capabilities as you scale. Contact the Plauti team for more details, to understand the right plan and setup for your needs!
Summary
Regardless of your org’s complexity and what your data quality pain points are, Plauti can surface valuable insights, which you and your team can then take action with confidence.
With over 20 analysis types to choose from and at no cost, whether you’d like to deep dive into one field or a thousand, you’ll know exactly what it takes to get your data AI- and reporting-ready in a fraction of the time.
On top of this, metadata documentation is automatically done, and previous run data is available for complete progress monitoring – all towards an easy-to-understand, well-documented system.
If you’re ready to up your data quality game, be it for an AI use case or for any others, make sure to take Plauti for a spin yourself.