

Engagement History reporting gives us the opportunity to build Salesforce reports based on Pardot marketing asset performance data. I will get on to the details later – but what this means, in short, is that marketers can now use standard Salesforce reports for more flexible Pardot reporting, beyond the WYSIWYG out-of-the-box reports.
In this post, I am going to show you how to create a Pardot Landing Page report in Salesforce that gives you an overview of how your Landing Pages performed. At a glance, you will be able to see:
- How many Leads/Contacts are part of that campaign
- The total number of times the Landing Page’s form was submitted, and how many individual prospects submitted.
- The % of prospects that submitted the form out of everyone who viewed the form.
Engagement History: Quick Recap
As I said in the introduction, Engagement History reporting gives us the opportunity to build Salesforce reports based on Pardot marketing asset performance data. Marketing assets include emails, forms, landing pages, tracked links, (plus others) – and therefore, performance metrics are opens, clicks, form successes etc.
This move is all part of Pardot’s transition on to the core Salesforce platform. In the Winter ’20 release, Pardot marketing assets will become legitimate objects in the Salesforce Object Manager, one step closer to being fully configurable!
Salesforce Reports: What’s the Big Deal?
Salesforce reports allow more flexible Pardot reporting, beyond the WYSIWYG out-of-the-box reports we’ve always known in Pardot; for instance, I can display and exclude the fields relevant to me, use different filter options, and group rows and columns.
Use Case: Pardot Landing Page Overview Report
Reporting Goal: to create a Salesforce report that shows Pardot Landing Page performance at a glance, with landing page KPIs such as unique form submissions and form submission rate.
There are 3 steps to follow:
- Create Connected Campaign
- Custom report type
- Build Salesforce report
Step #1: Create the Connected Campaign
Are Connected Campaigns enabled for your account? Especially if you cannot answer straight away, the first thing to do is check. Then you can continue…
Create a Salesforce campaign for your ‘contact us’ form, if you haven’t done so already.
Go to the form in Pardot you want to report on.
I find there’s still legacy set up lurking in Pardot accounts, back in the times where Pardot Campaigns were unconnected. Now that you have a Salesforce connected campaign synced with Pardot, you can associate the Form to that Connected Campaign.
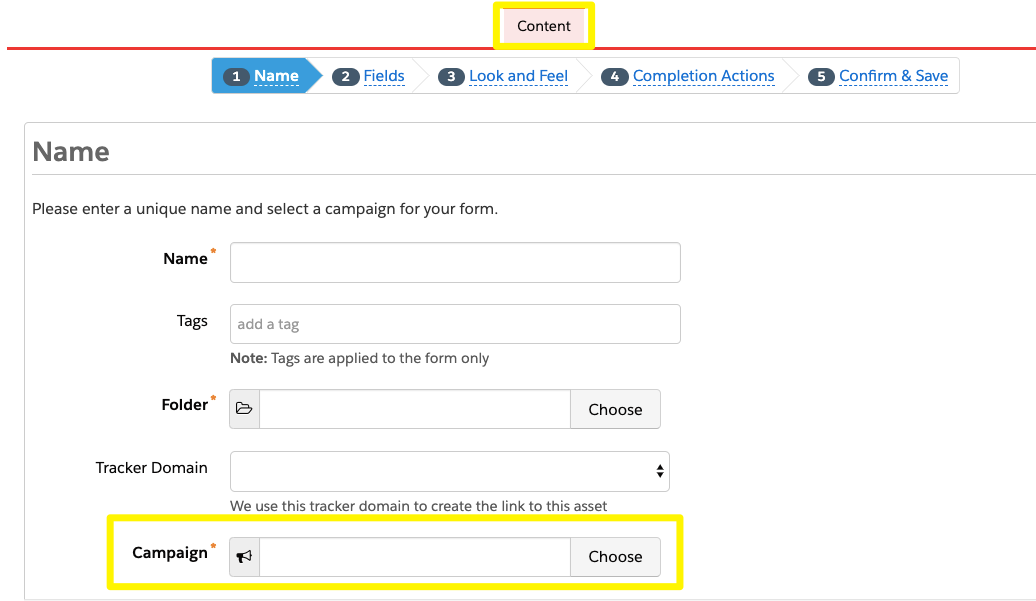
This is a nice piece of best practice to follow going forward.
Step #3: Create the Custom Report Type
Completing this third step will depend on your Salesforce permissions (you will need to access Salesforce Setup and be able to create custom report types).
Go to Setup, and search for ‘Report types’.

Create a new report type.
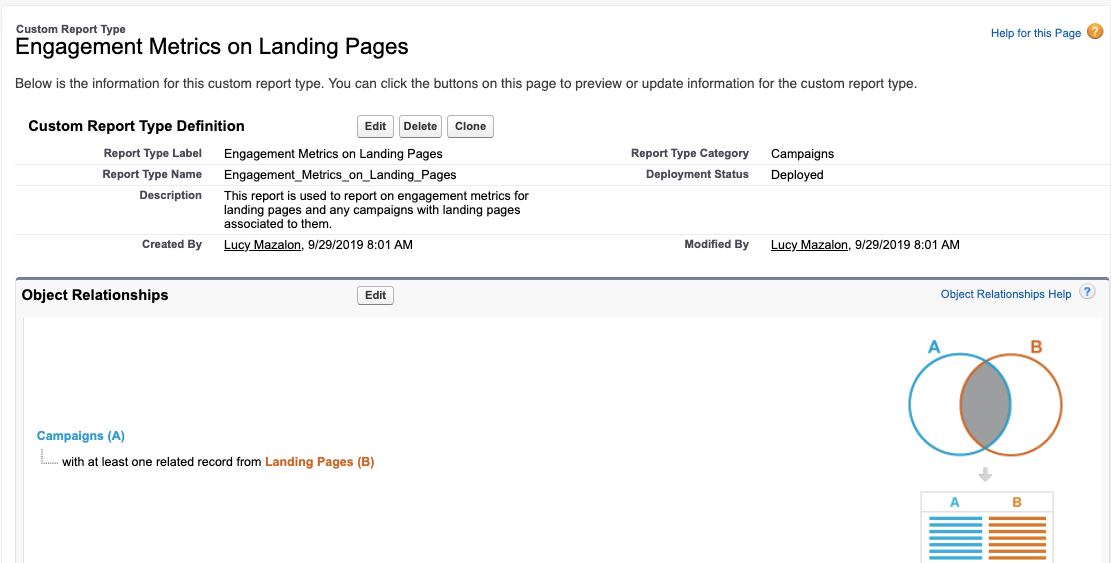
- Primary Object: Campaigns
- Report Type Label: “Engagement Metrics on Landing Pages”. There’s best practice to how report types should be named to avoid leading fellow users to use the wrong report type, leading down a dead-end! Also, be sure to respect your organisation’s naming convention.
- Report Type Category: Campaigns
- Choose Deployed for it to be visible to users.

- Next, we get on to the Object Relationships. Each of the steps below is a new box on the canvas area, select the objects by opening up the dropdown box.
- Campaigns
- Landing Pages: Each “A” record must have at least one related “B” record.
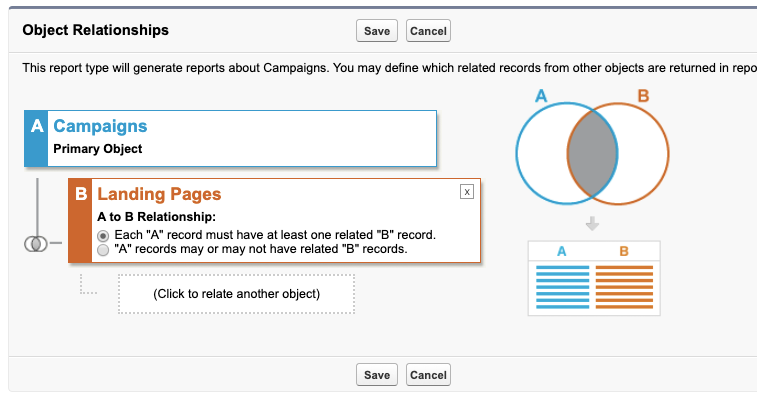
The finished overview screen should look like this:
Step #3: Build the Salesforce Report
I write this tutorial assuming that you are not entirely new to using the Salesforce Report Builder; if you are, I suggest looking at other resources as primers first!
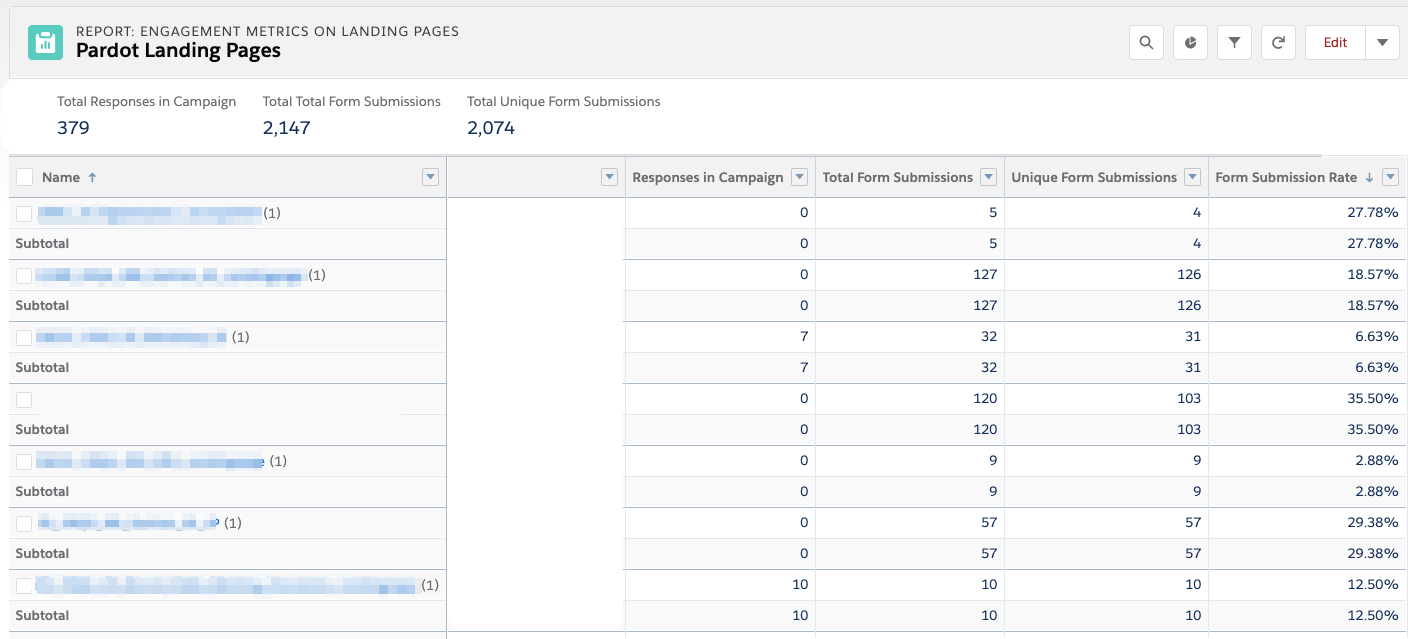
This is the report we are going to build:
When you launch the Report Builder, your deployed report type will be available in the list.
Switch to the ‘filter’ tab, and filter by any date fields (eg. campaign start date this quarter), or any other parameters:

Switch back to the ‘Outline’ tab, and add columns the columns, including (but not restricted to):
- “Responses in Campaign”: how many Leads/Contacts are part of that campaign
- “Total Form Submissions”: the total number of times the Landing Page’s form was submitted
- “Unique Form Submissions”: the number of individual prospects that submitted, taking out any repeated submissions.
- “Form Submission Rate”: the % of prospects that submitted the form out of everyone who viewed the form.
Don’t forget to take a look at the other fields available, you may find one that’s a useful metric for your team!
Summary
In this post, I’ve shown you how to create a Salesforce report that shows Pardot Landing Page performance at a glance, with landing page KPIs such as unique form submissions and form submission rate.
Now that you’ve opened up your Landing Page reporting on the core Salesforce platform, start experimenting with adding report groupings for charts (another post, for another time!).

Comments: