

A Salesforce pipeline report can analyze company goals through individual sales targets and opportunities. Broader goals (in terms of revenue, leads, and sales) can be strategized for and measured through monthly pipelines, funnels, and historical figures.
When used optimally, pipeline reports can accurately forecast revenue, guide long-term sales strategies, and shorten the sales cycle. But how do you know which type of report to use? In this article, we’ll cover the five types of Salesforce pipeline report you need in Salesforce right now!
Advantages of Pipeline Reports
So what advantages do pipeline reports have over other forms of sales analysis? Pipeline reports are a form of sales analysis that allow you to align sales and marketing goals and analyze them together. The pipeline shape can evaluate revenue and the number of customers in different stages of the sales funnel (prospecting, analysis, proposal), while informing sales enablement and content marketing decisions.
Reports also provide a tangible way to create a step-by-step strategy – using individual reps – to achieve broader targets. Analyzing sales performance and identifying leaks in the funnel can guide sales training sessions and create sales strategies for reps to employ.
When an organization needs to scale rapidly, pipeline reports can be analyzed to identify areas of high growth and conversion.
While each category of Salesforce pipeline report has its place in sales analysis, the following five types provide the maximum benefit in scaling operations and shortening sales cycles.
1. Pipeline Shape
The pipeline shape report features the amount of opportunity by pipeline stage in terms of the number of leads or revenue.
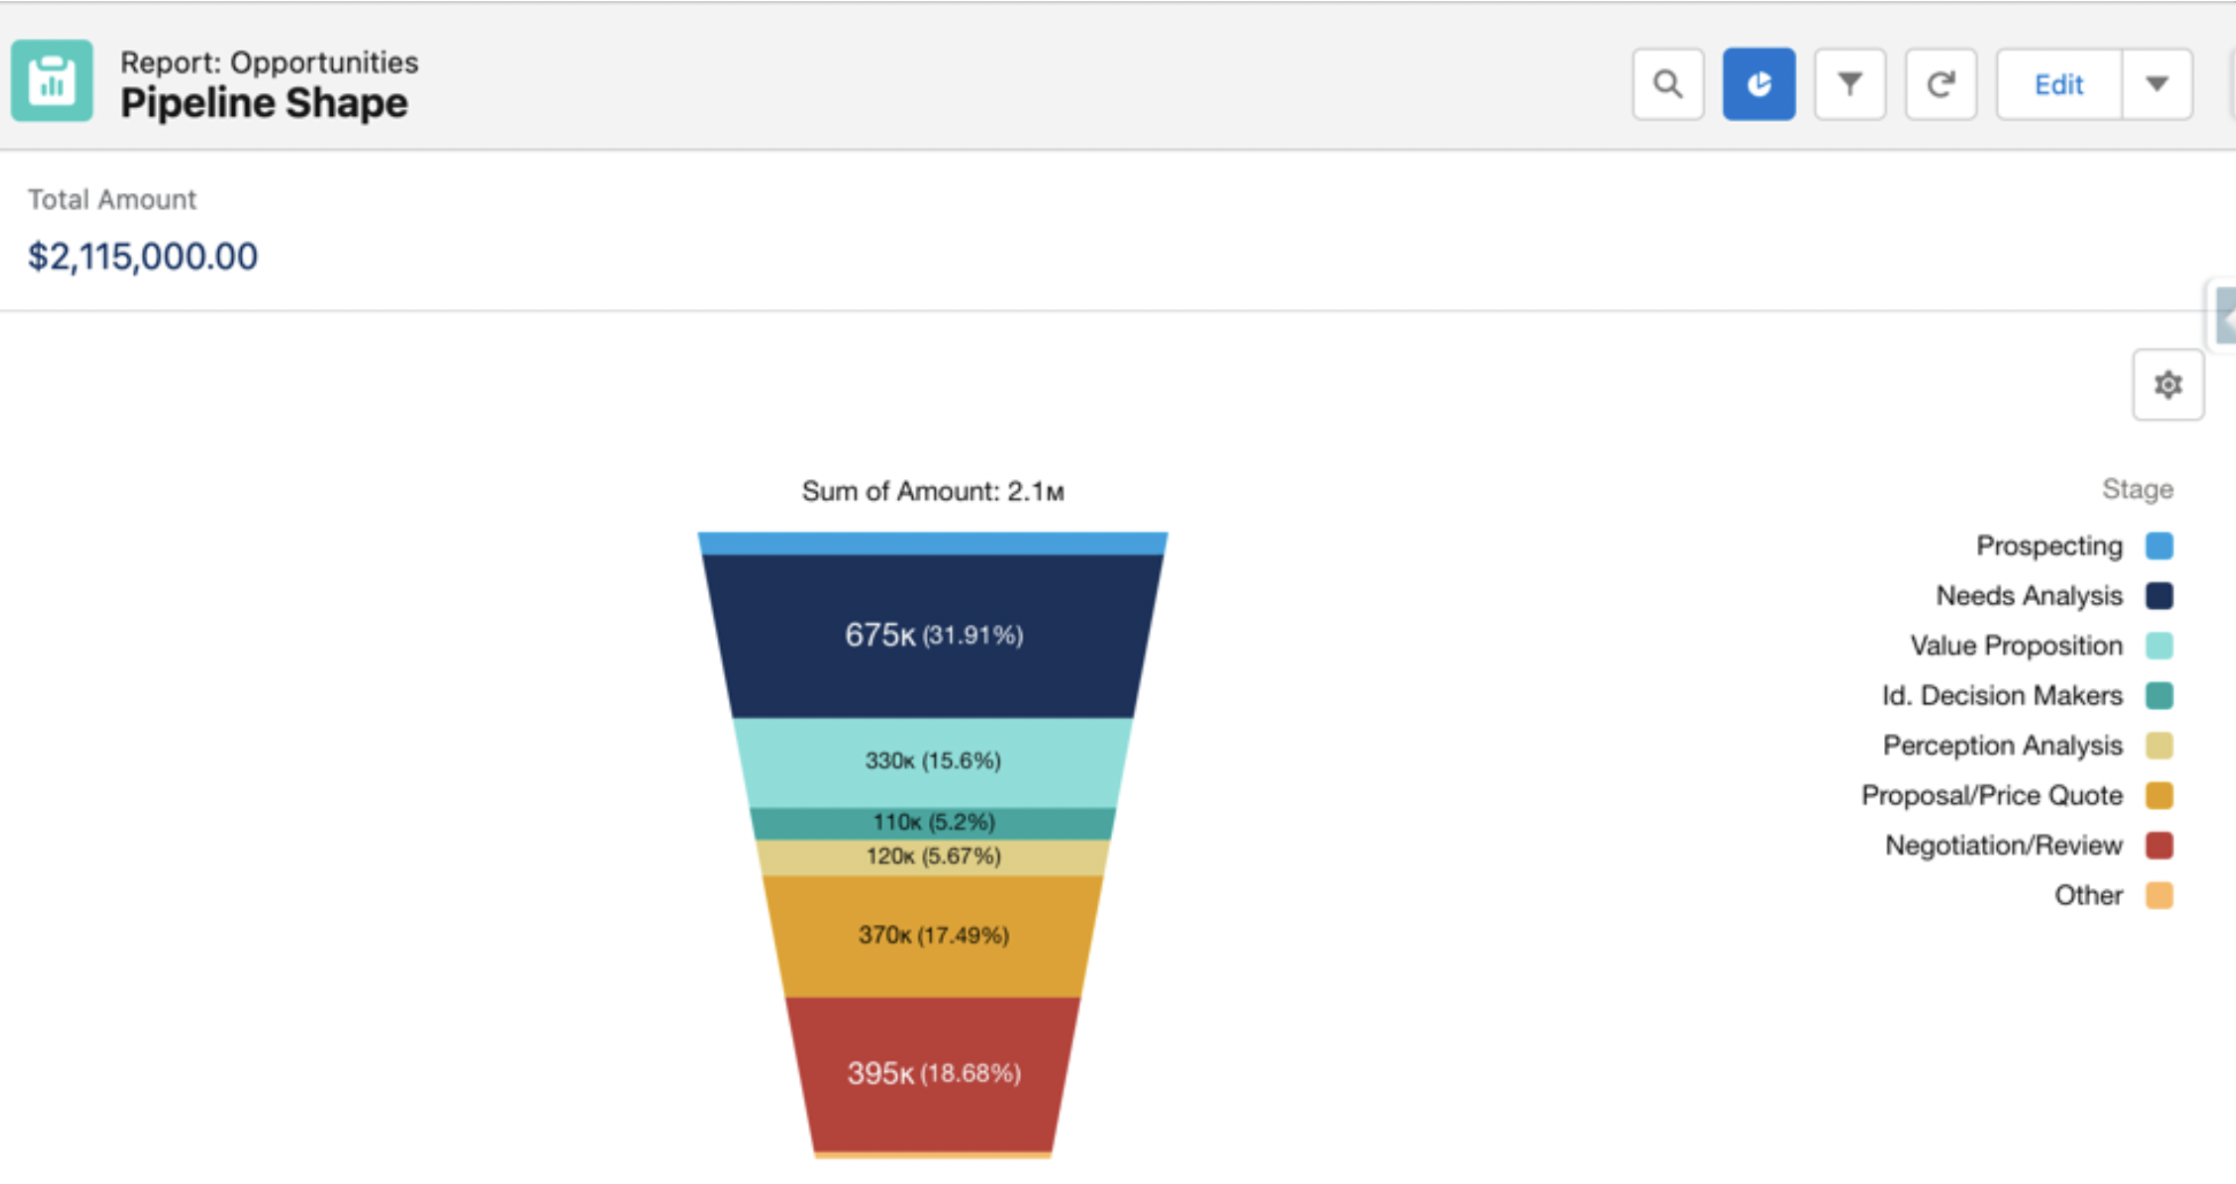

Ideally, the shape of the funnel should remain constant and prospecting should outweigh opportunities negotiated. If both these metrics have only a slight difference in volume, it might indicate a loss of early-stage opportunities.
Or, if the top of the funnel appears too broad, it could indicate the lack of conversion content and appropriate sales strategies.
The pipeline shape report can be analyzed to assess how many opportunities need to be created to maintain both profitability and growth. For example, if inbound leads have a conversion rate of 20%, and at least ten opportunities need to close to hit the sales targets, the minimum number of inbound leads should be 50. This way you can assess whether new opportunities are being created or whether the pipeline is at risk.
Often overlooked for its simplistic nature, the pipeline shape report can be crucial in informing marketing decisions. Decisions on which category of content efforts to ramp up and which strategies are working can be made through the pipeline shape report.
While the funnel shape is excellent in gauging the overall health of the sales and marketing teams, it doesn’t tell us where opportunities arise or which channels convert best. This brings us to the second must-have Salesforce pipeline report.
2. Pipeline by Source
This report is key for marketing teams to see which campaigns are creating pipelines and where they should be putting their marketing dollars. Adding indicative formulas to this report allows you to measure Campaign Actual Cost and work out profitability.

For example, if websites and webinars are bringing in a large share of leads and revenue, more budget should be allocated to those channels – webinars with more expert speakers, more website content, and possibly repurposing webinars into blog posts. Doing this amplifies the possibility of bringing in more qualified leads and, in turn, gives marketing teams measurable and achievable targets.
This report is especially helpful for sales reps if they have an outbound quota – they can contrast their outbound efforts with inbound ones through this report to gain an understanding of conversion tactics.
For example, if a particular webinar (say, on the collaboration of your company’s product with the customer website) is bringing in a high volume of leads, it would boost ROI to integrate this content in your cold outreach and outbound channels.
3. Closed Opportunities (Revenue)
This report shows opportunities that were closed-won or closed-loss. The chart below displays how much of the pipeline was closed-won in terms of revenue.


The traditional benefit of this report is a clear overview of the category of profitable opportunities, as well as the opportunities that need better sales training or more representatives.
Sales managers can also use this chart to identify the best performers and recreate their strategies for team-wide adoption.
A more unconventional benefit of this report is that a close look at the closed-won pipeline can highlight areas of potential when viewed alongside products and discounts. Campaigns for upselling and cross-selling in these areas can further enhance closed-won ratios and drive more revenue.
For example, let’s say that your brand sells hair care products and a particular series of shampoos is showing up frequently in the closed-won window. Offering conditioners of the same category (cross-selling), or a multi-pack of three shampoos (upselling) could create rapid sales.
Analyzing closed-lost opportunities is also a useful way to highlight bottlenecks where sales reps could use more training and marketing teams could create more content.
Closed-lost opportunities that accumulate over time or occur repeatedly can point to a deeper problem (such as a lack of customer awareness) which might be keeping sales reps from closing deals. Closed revenue reports help identify these instances and trigger remedial action.
Leaking funnel reports can provide an even closer look at problematic sections and sales fronts that need addressing. Let’s take a look.
4. Leaking Funnel Reports
The leaking funnel report shows the opportunities that went directly from each stage (prospecting, investigation, evaluation, negotiation) to the closed-lost stage. This report identifies the areas where opportunities are falling out of the pipeline and what this means for sales managers.

For example, if a low number of opportunities are falling out at the negotiation stage, it might indicate that the sales reps are successful in the rest of the sales cycle as well as bringing deals to a close.
In contrast, a high number of deals falling out at the validation phase might mean that the sales reps are ineffective in conveying the right information or identifying decision makers.
A good sales funnel report triggers audits into how each component of the sales cycle is structured and, in turn, eliminates losses quickly.
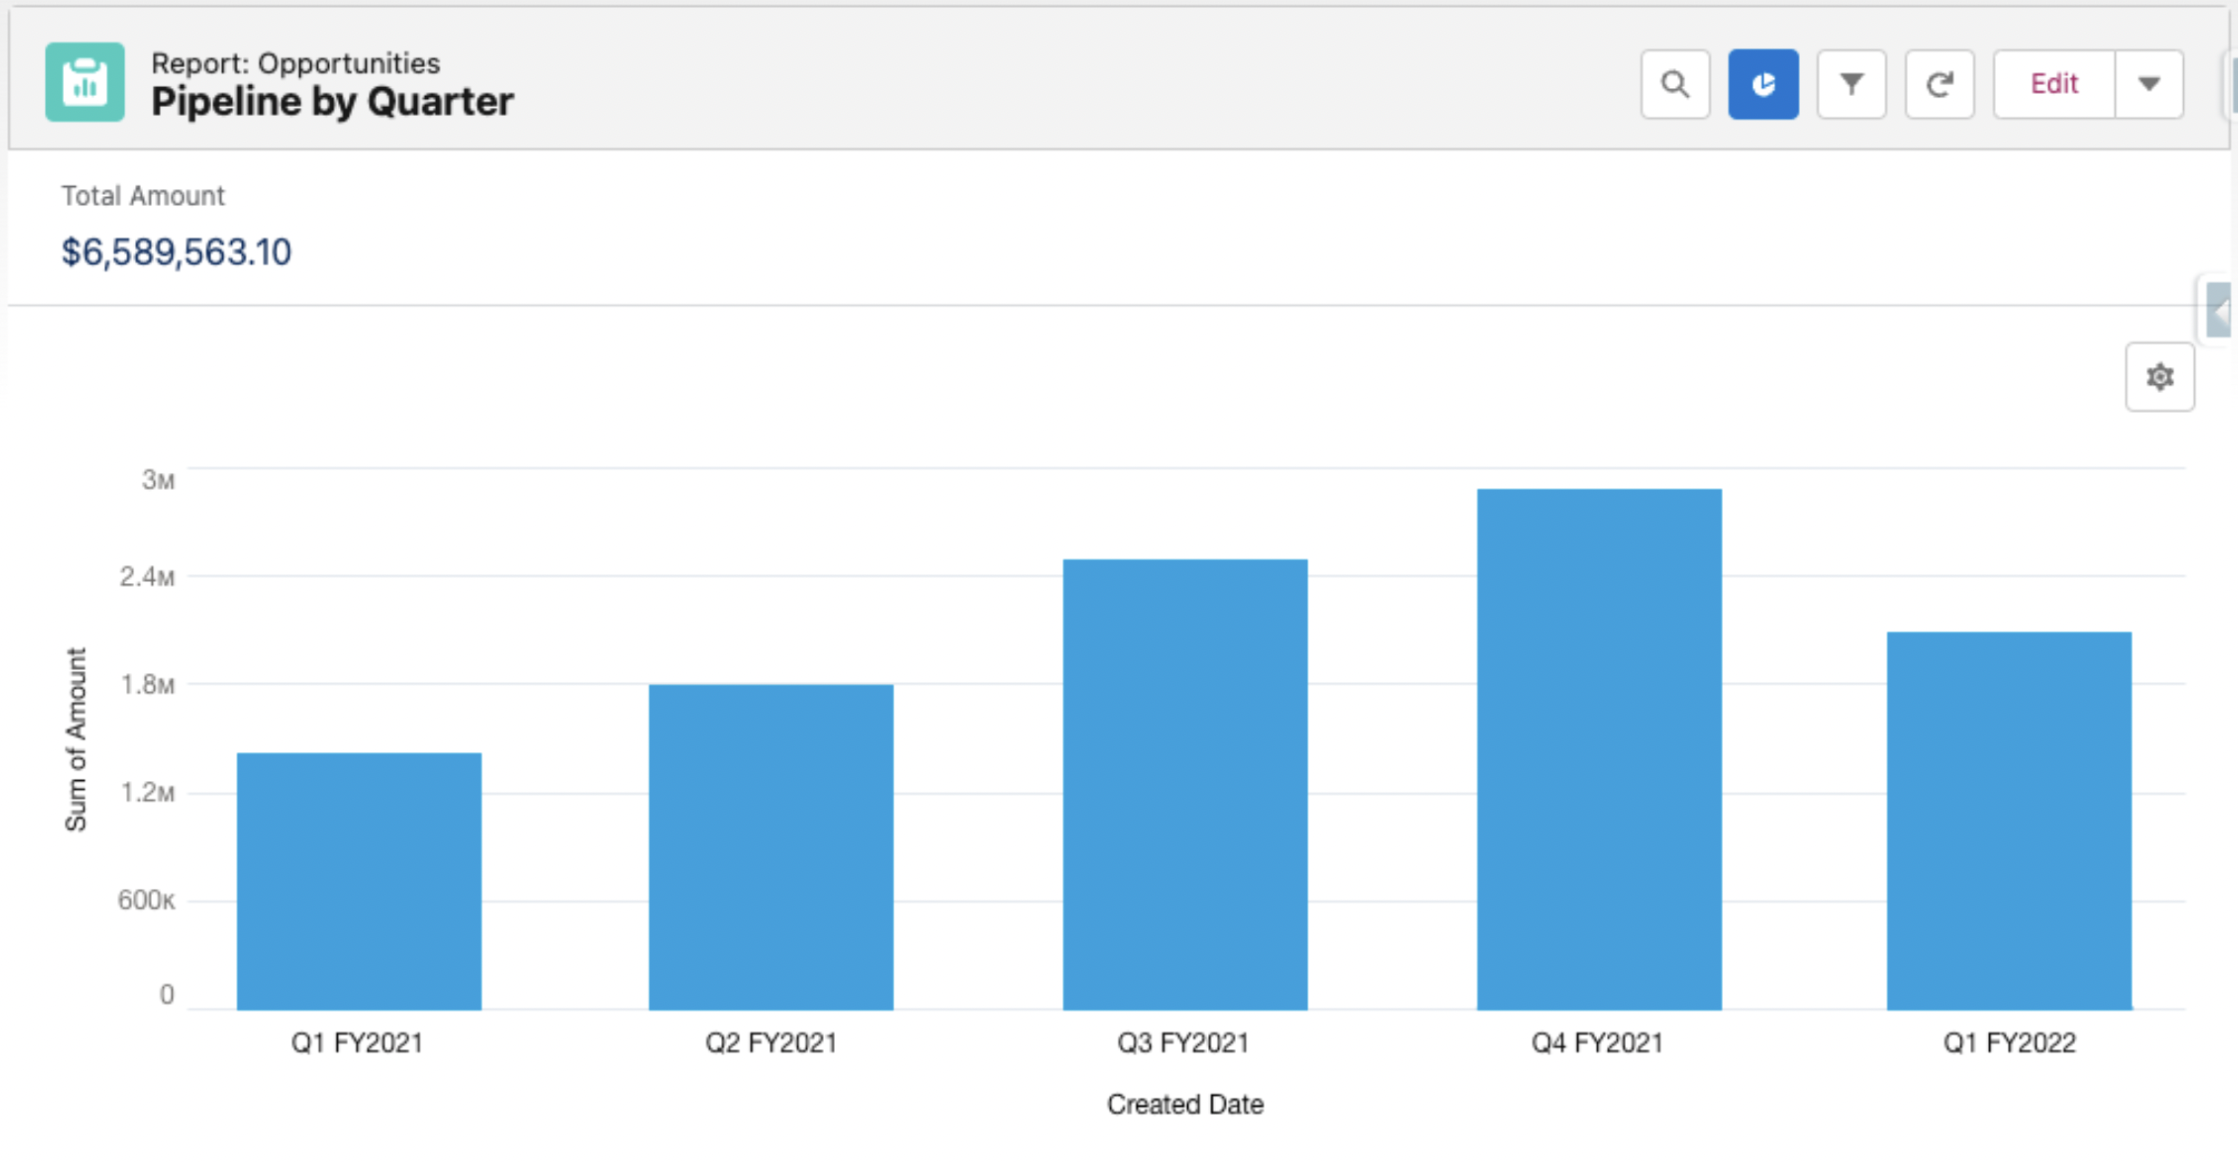
5. Historical Pipeline Reports
Historical pipeline reports determine pipeline build over time:
- Month over month
- Week over week
- Quarter over quarter
Understanding this data can answer three important questions for sales managers:
- What is the pipeline created over time?
- Which reps are performing better than others?
- What are the sales trends presenting over time?
This information can be used to build awareness of emerging buyer trends and predict revenue based on these trends. For example, the holiday season can bring in new opportunities, and sales targets should be adjusted as such.
It is also useful to train newer sales reps in best practices. A careful analysis of historical data, especially when viewed with other sales reports, can point out trends before they have a material impact.
Here are some examples of historical reports:
- Pipeline created
- Pipeline created by rep
- Pipeline created by company size (small, medium, enterprise)

Summary
A Salesforce pipeline report can offer tremendous value in building a business, both for product-led and sales-led teams. When viewed by a sales officer with deep personal insight into their sales reps, these five pipeline reports can help to strategically guide growth and scale operations – sometimes exponentially.
Next, check out our complete guide on how to create reports in Salesforce.