


There are many use cases for Tableau out there – especially when it comes to Tableau and Tableau CRM (formerly Einstein Analytics). The way you can use these platforms depends on how they’ve been implemented, hopefully delivering real, tangible business outcomes.
Not only have these tangible business outcomes justified the investment made for the licenses, consulting support, and stakeholder involvement, it has also paved the way for an exciting and transformational data analytics roadmap.
Here are eight real-world Tableau CRM and Tableau examples and use cases that we consider to be the most popular among our clients.
1. Sales – Actionable Sales and Revenue Forecasting
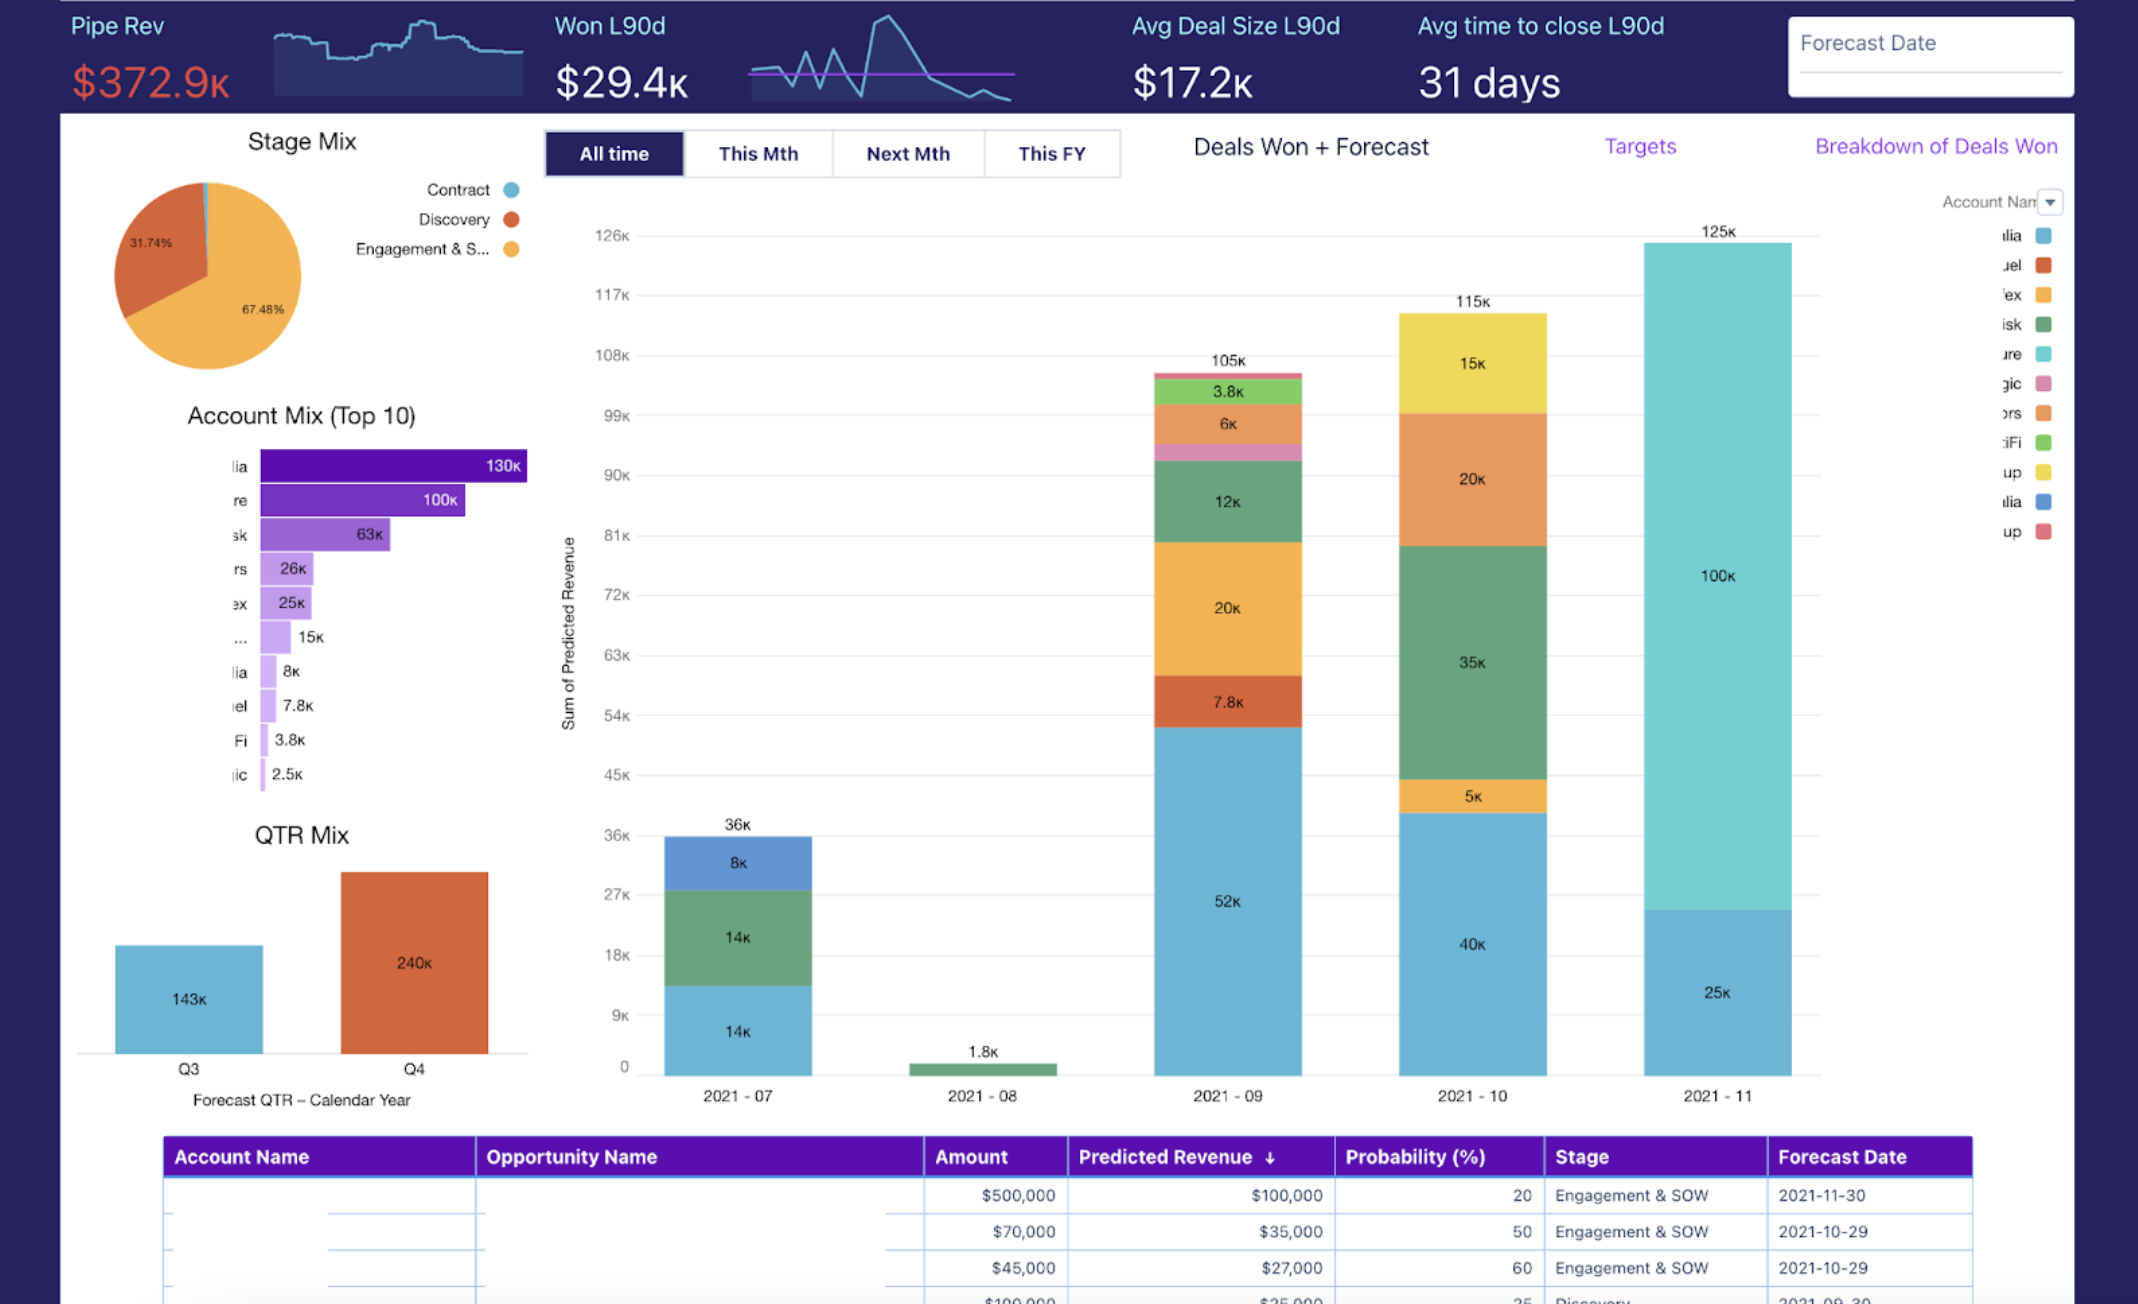
A growing professional services business was struggling to gain insight into their sales forecast – the standard Salesforce pipeline reports just weren’t cutting it.
After implementing Tableau CRM (TCRM), we built a sales forecast dashboard to combine opportunities won with the forecast revenue from open opportunities. This was easily sliced and diced using charts to filter the data by stage, account, expected/delivered quarter, etc.
Once filtered down to the desired cohort, the record table view below the charts was used to identify opportunities for discussion or action. The TCRM record actions were then utilized to open the record in Salesforce, assign a task for follow-up, etc.
The business outcome was a simple, flexible, and intuitive dashboard that informed business leaders and enabled smart decision-making.
2. Service – Customer Service and Compliance Insights
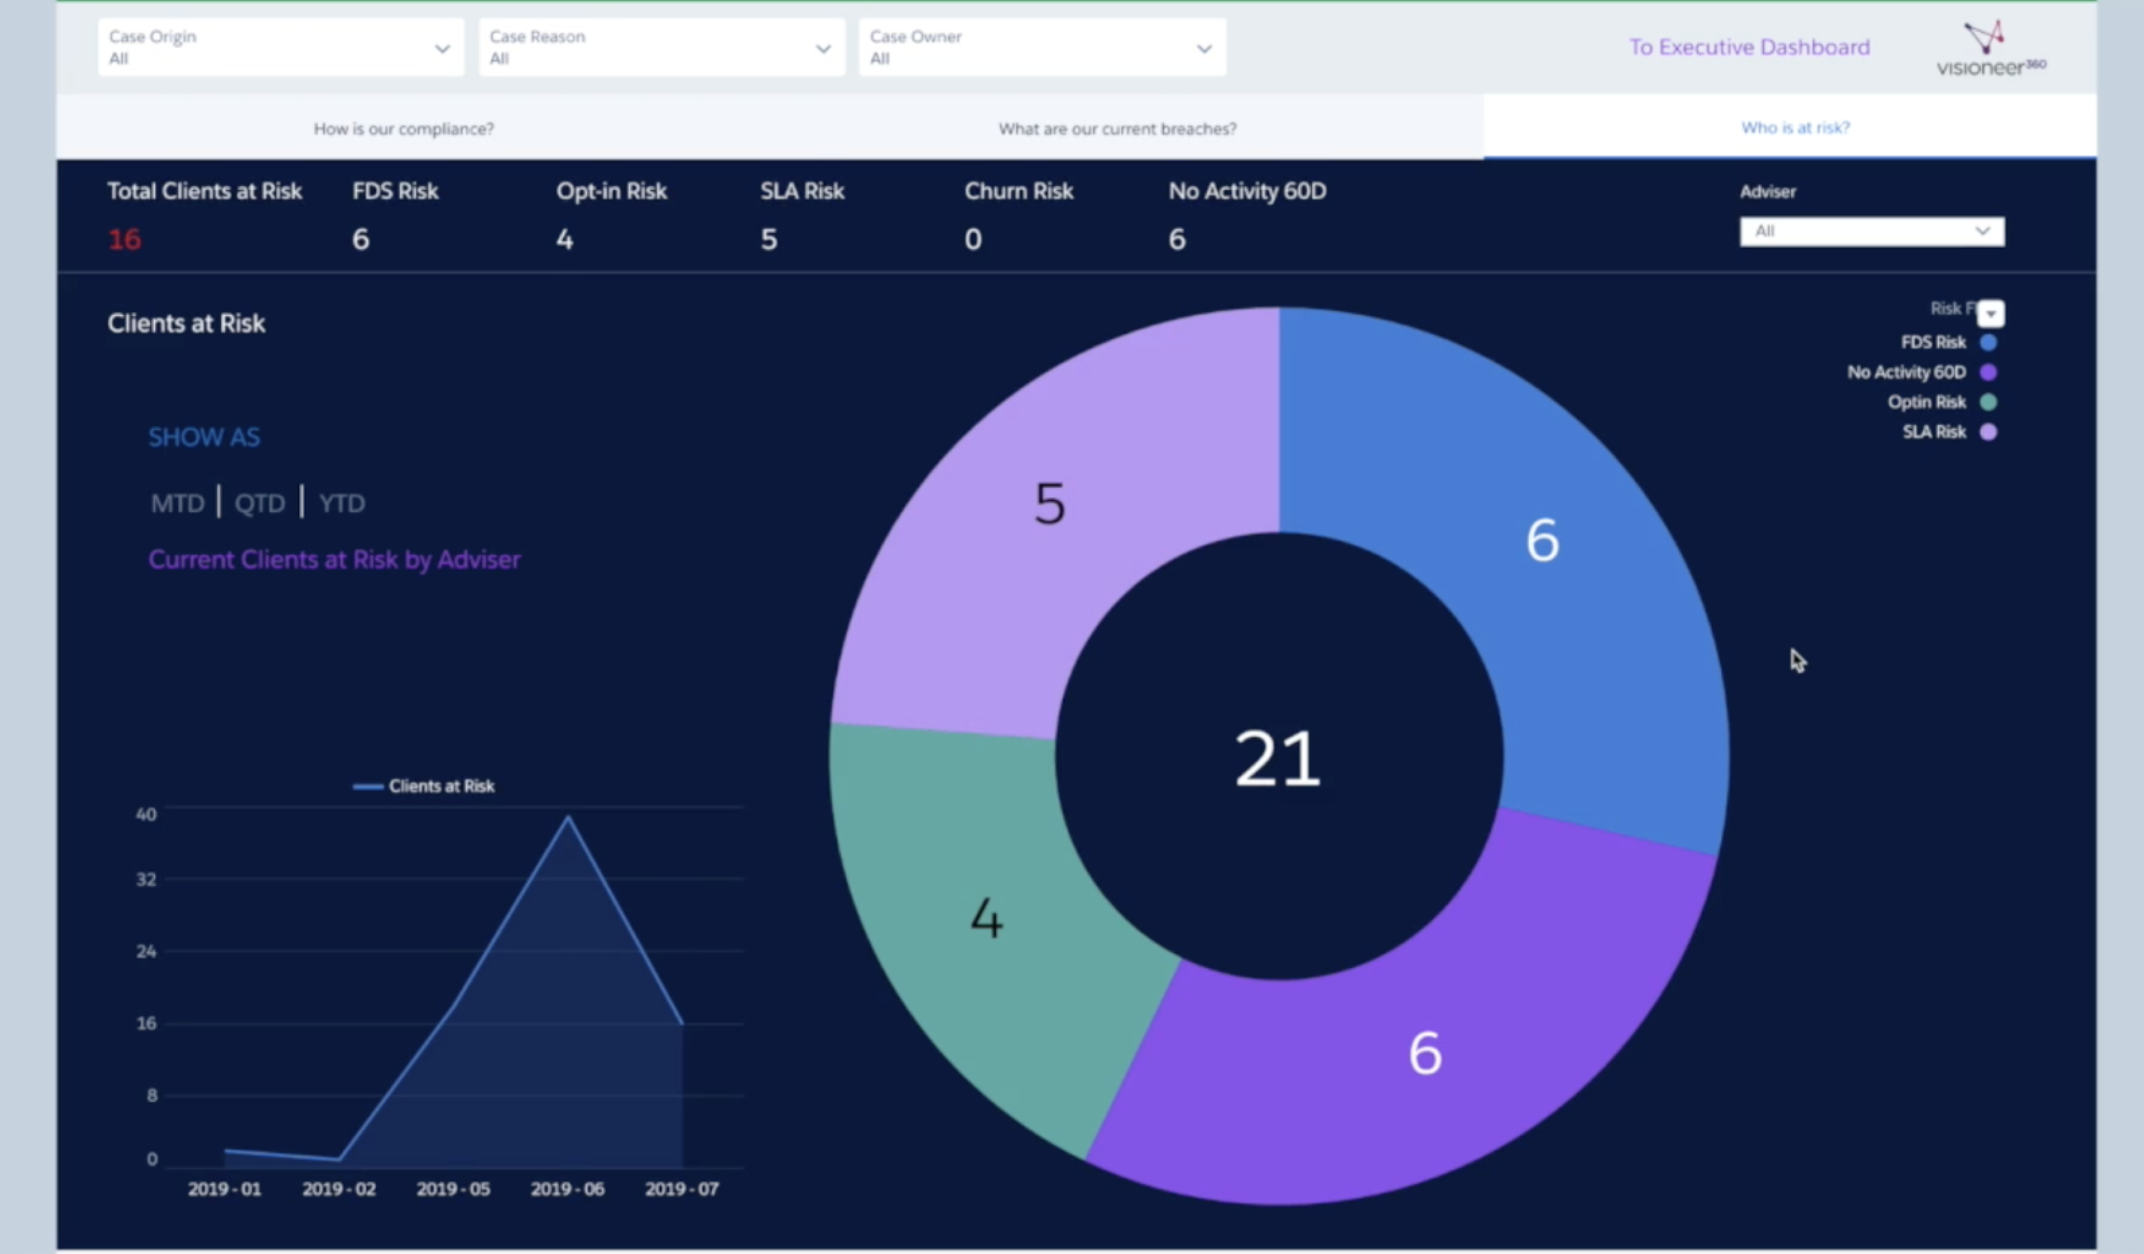
An innovative financial services business felt the ever-increasing pressure of a volatile regulatory environment. The ability to monitor compliance on an individual client basis, and take proactive action before breaches occurred, had become business-critical. The business used Financial Services Cloud, but out-of-the-box reports didn’t provide the required information. Even the out-of-the-box reports provided by TCRM for Financial Services Cloud did not deliver the desired insights.
However, following a significant investment of time (required to understand the complex business and regulatory landscape), we were able to design and deploy TCRM dashboards that:
- Made it easy to identify current and past breaches.
- Enabled business users to identify possible future breaches and take proactive steps to prevent them from occurring.
These beneficial insights provided the ability to monitor client compliance, identify the risk of breaches before they occurred, and take proactive action to ensure ongoing compliance.
3. Sales – Identifying Deals at Risk Using AI
Imagine that you are a giant technology business, delivering best-in-class products to customers around the globe. You have an army of salespeople, overseen by a team of driven, capable managers and VPs. Your account executives have many opportunities that they are responsible for, which rolls up to hundreds of deals in the Salesforce reports of sales leaders. Think of the challenges that these leaders have when it comes to sales insights:
- How can they prioritize the deals their team needs to focus on, in order to deliver the best revenue result?
- With so many opportunities in front of them in their Salesforce reports, how can they identify deals that require attention and are at risk of being lost?
- How can they obtain an intelligent, realistic forecast of revenue?
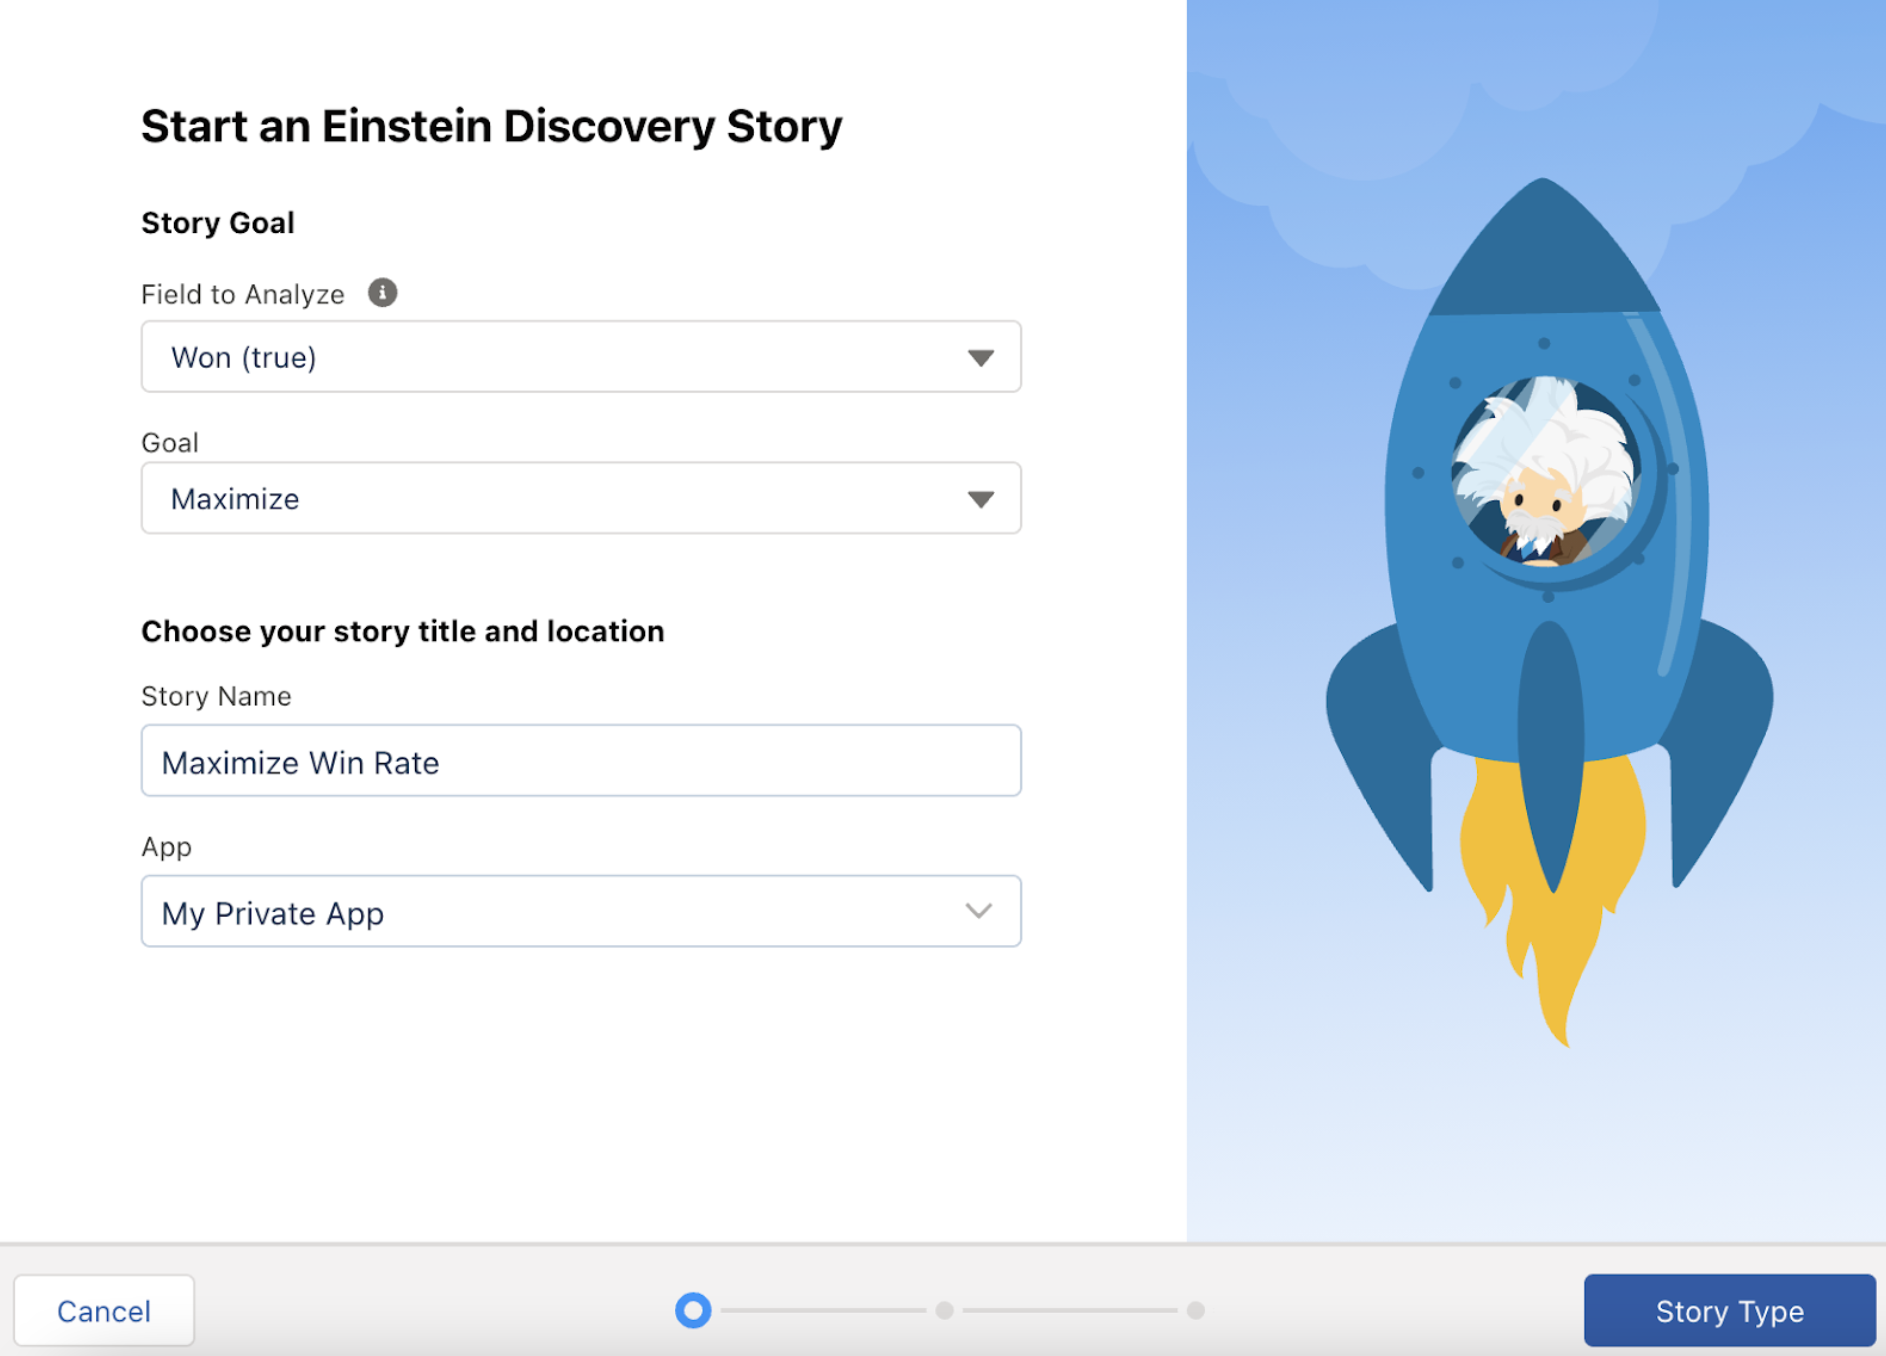
This is where Tableau and Einstein Discovery come into their own.
First, we built a dashboard that enabled sales leaders to easily drill down into the data by region, territory, team, etc. Second, we added the actuals data from the customer’s ERP to show pipeline, targets, and actuals on one page. Third, we built an Einstein Discovery machine learning model that would analyze historical patterns and identify ways to maximize the opportunity win rate.
What was the business outcome? Business leaders were able to quickly review their prioritized deals and identify those at risk of not closing, by way of a simple flag created from the Einstein Discovery prediction. This information could then be actioned directly in CRM, where sales teams would focus their attention on high-value, high-risk deals. Boom!
4. Service – Cross-object Reporting and Service Delivery Dashboard
An Australian not-for-profit organization had a wealth of data sitting in Salesforce. However, it was extremely difficult to obtain meaningful insights as the native reporting and dashboards limited their ability to drill into data that was housed in a complex object model.
In particular, reporting on the services delivered on a quarterly basis was manual, tedious, and laborious; reports took several days to deliver and involved the manual export and combining of many reports in Excel. The end result was out of date by the time it was delivered to leadership, and it was limited to a static screenshot embedded in a PowerPoint slide.
We worked with their team to design and implement a suite of data analytics using TCRM to provide a 360-degree view of their data. In their words, the “finished product is fantastic. It looks great and does everything they promised, which we didn’t think would be possible!”
5. Insurance – Advanced, Actionable Claims Analytics
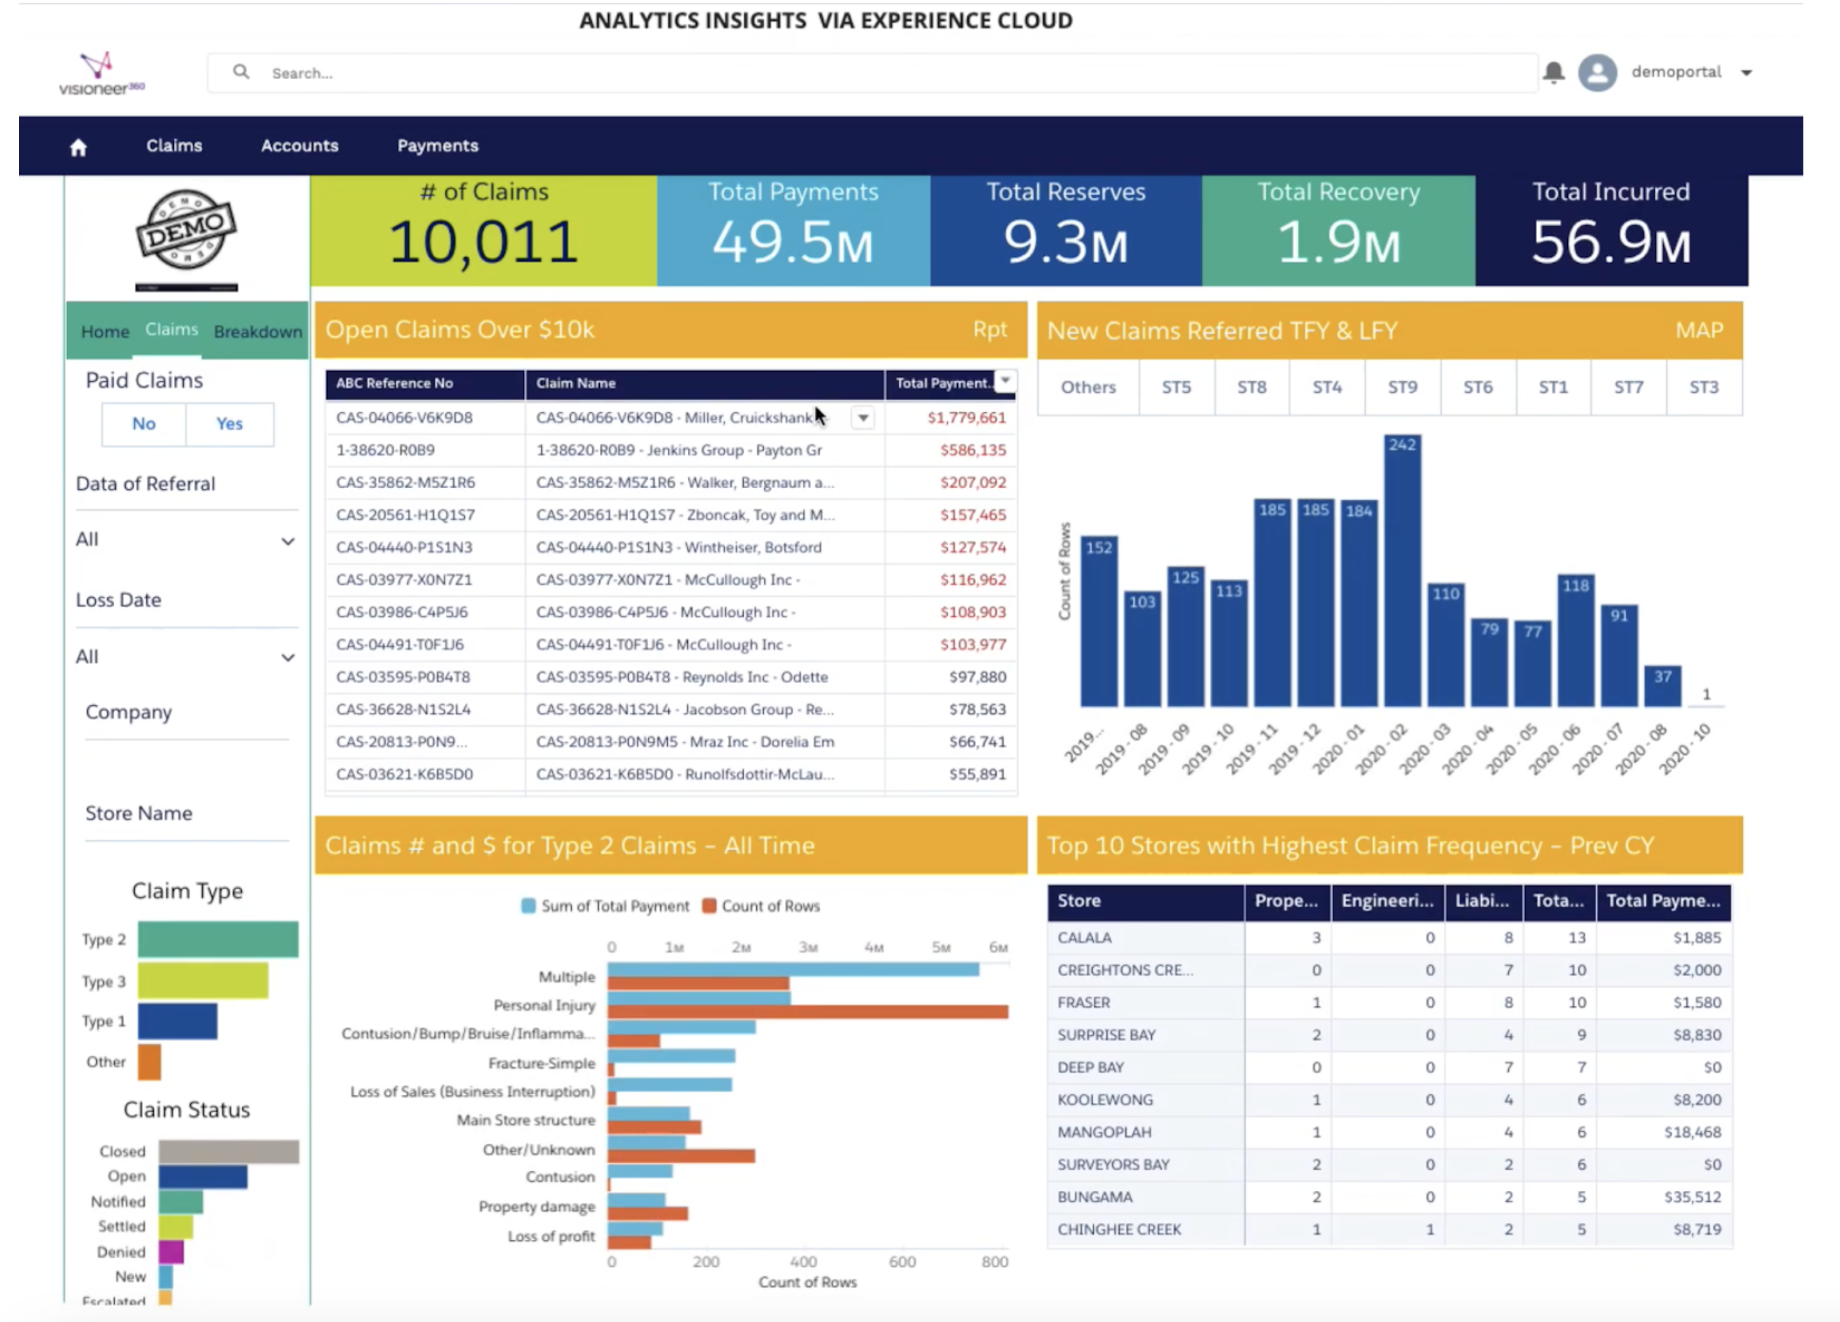
A Sydney-based insurance broker managed a large DMF (Discretionary Mutual Fund) for a Board that reported to their end customers. However, the Board was continuously let down by their claim managers, both operationally and also with regard to reporting and analytics. They expressed frustration that they could not access all their data in one place, with real-time access to information and insights.
The solution involved investment in Financial Services Cloud to deliver a scalable claims management solution, as well as investment in Tableau CRM and Experience Cloud to deliver reporting to the Board. The business outcome provided industry-leading, dynamic, and actionable data insights, available on-demand to board directors, as well as other partners, via an accessible portal.
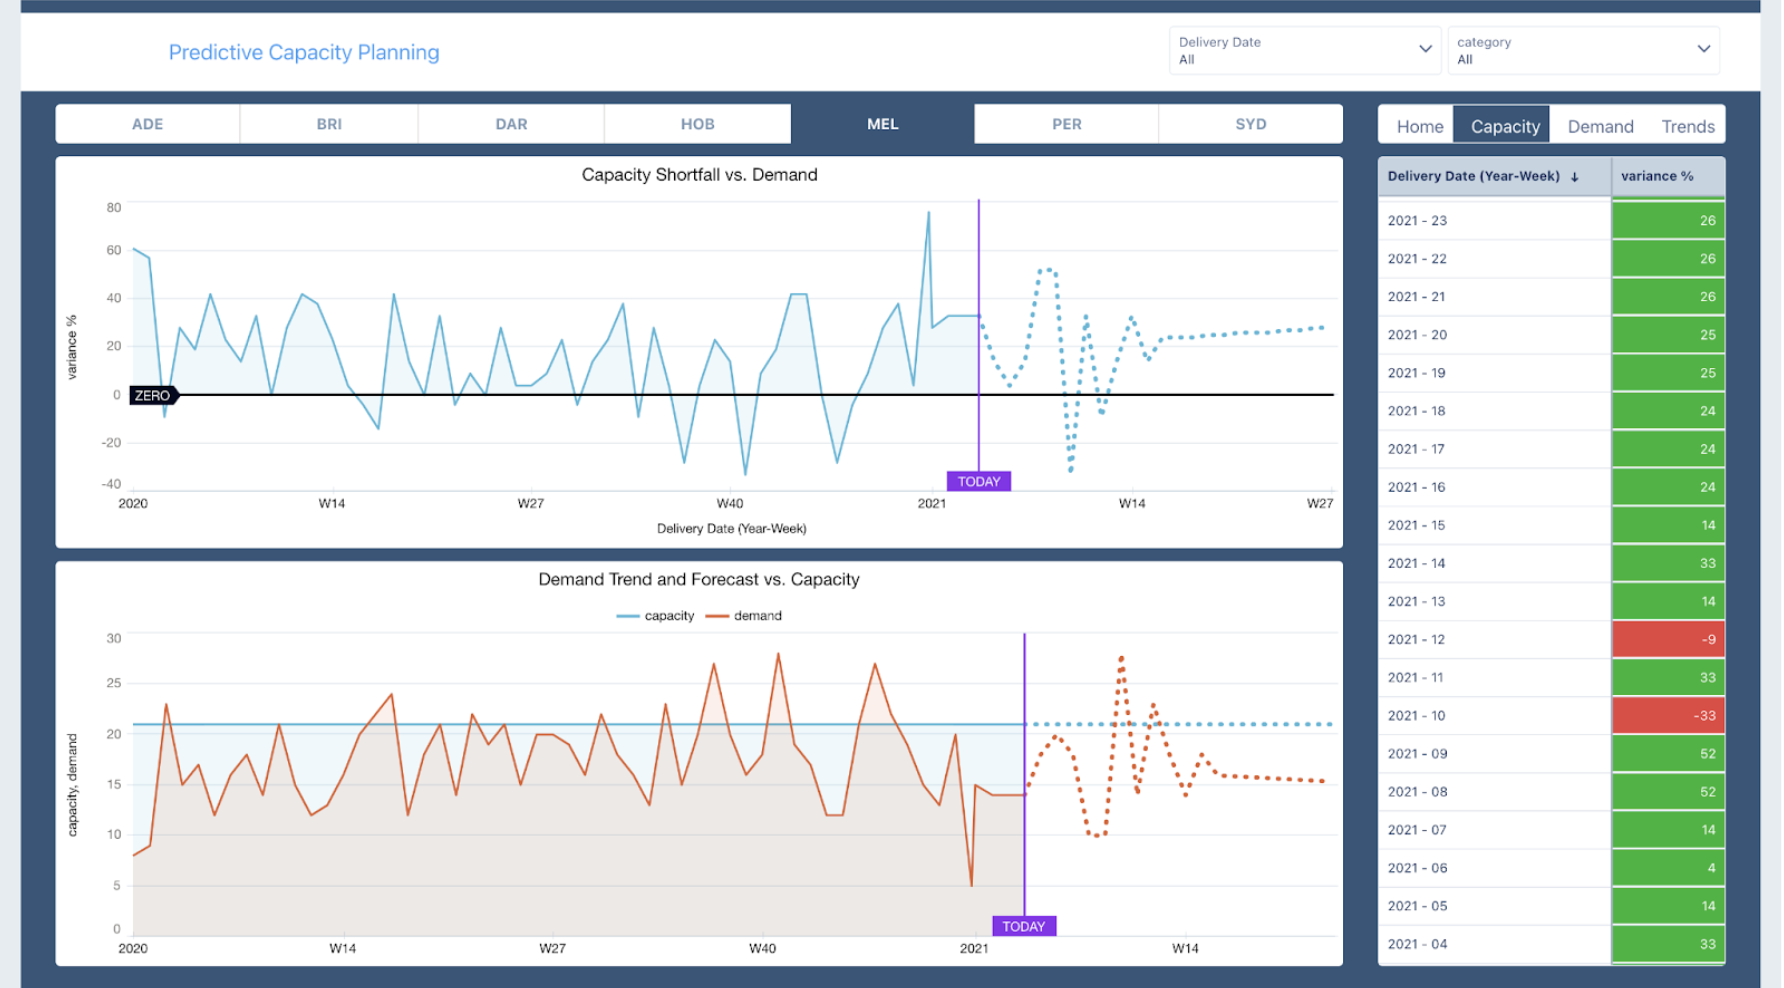
6. Logistics – Predictive Capacity Planning
This rapidly-growing logistics business uses Salesforce and it also utilizes a large and diverse technology stack. Their data architecture is complex and the volume of data produced is staggering. Gaining predictive, actionable insights into performance, demand, and capacity was always part of the vision but had not yet been realized.
The business relied upon rearward-looking, demand-driven reporting, but had a vision for predictive, self-serve analytics that delivered one source of truth for decision-making across the organization.
How was this solved? We implemented both Tableau and Tableau CRM to deliver predictive, actionable capacity planning, powered by machine learning.
Work is now progressing in the areas of data integration and governance to enhance these insights. The goal is to deliver actionable insights into sales by channel, parcel movement, pipeline management, sales activities, and franchisee performance.
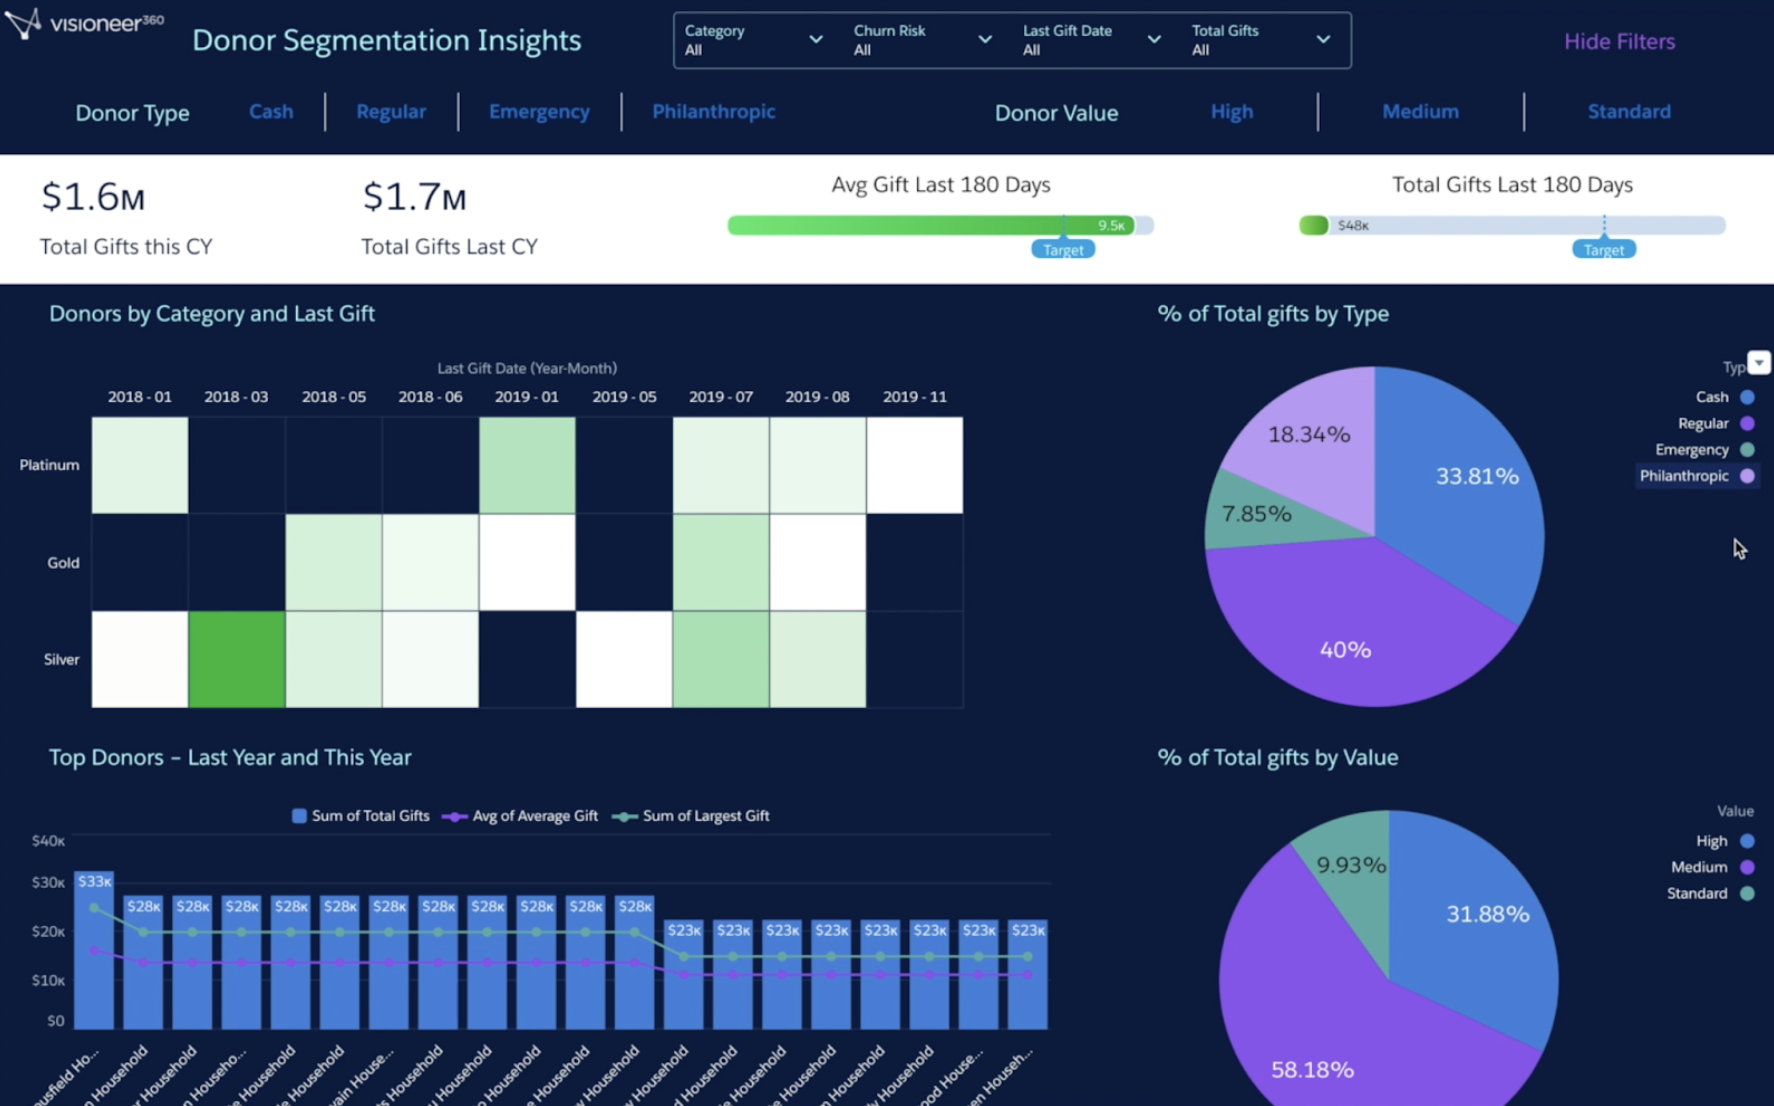
7. Not-for-profit – Donor Segmentation and Bulk Allocation
Donor segmentation is a strategy through which a Not-For-Profit (NFP) institution divides its donor population into smaller groups. These groups, known as segments, are based on commonalities in giving preferences, communication preferences, or other factors.
Donor segmentation allows NFPs to send personalized communications, which is what donors want. It also enables the NFP to find the “best fit” recipients for a particular appeal or campaign, and therefore increase the return on investment (ROI).
There are, however, many challenges for NFPs when it comes to donor segmentation; data collection, management, analysis, and execution are very difficult. Lacking the budget and resources to implement expensive enterprise platform solutions, NFPs have often been forced to adopt less-than-optimal approaches and systems, requiring considerable manual effort and complex workarounds.
With the help of Tableau CRM, we delivered an integrated, intuitive solution for data segmentation, enabling NFPs to go easily from data to insight to action. Empowered by systems integration, data analytics, and platform automation, donor segmentation and communication have never been easier or simpler. Once the target audience has been identified via a simple dashboard, the selected donors are added to a Salesforce campaign with just a few clicks. Campaign engagement and conversion data feeds back into the dashboard to further guide decision-making.
8. Government – Dynamic, Actionable Analytics for Project Oversight
This government agency lacked one reliable source of truth for project governance data, even though a wealth of project information had been gathered. The data analytics and business insights at the agency were rearward-looking, rather than predictive and prescriptive. As a result, many team members were building their own reports and dashboards offline, and both the agency’s vision and mission were significantly hindered.
The government agency engaged us to review their data architecture and governance. We then delivered an innovative design and built it with Tableau and Tableau CRM. The result was an outcome-based approach – the delivery of leading indicators to project governance analytics-enabled proactive identification of risks and issues.
However, a challenge remained – could the existing Tableau dashboard be combined with the new TCRM dashboard on one page within Salesforce? If not, user adoption of the dashboards would be greatly hindered, as users would need to see the data on one page, regardless of the platform. Our team worked with the agency technical team to successfully deliver this innovative outcome and ensure user adoption of the analytics.
Tableau and Tableau CRM on a single page within Salesforce – it can be done and it was a game-changer for this government agency.
Summary
From not-for-profits to government agencies, we have helped a wide range of organizations benefit from the vast functionality available on Tableau and Tableau CRM. It’s easy to see the value in these accessible, flexible, and intuitive platforms, which enable smart decision-making via dynamic, actionable data insights, reporting, and analytics. We look forward to seeing more companies utilize Tableau and Tableau CRM on their way to achieving real-time, tangible business outcomes.